News — 25 September, 2024
South America in Flames: Fighting Fires with Open Mapping
Wildfires in South America are consuming thousands of hectares of crops and forests in conservation areas in countries such as Bolivia, Peru, Ecuador and others. Let's learn about the relief efforts emerging from open mapping communities.
This year’s wildfire season in South America is breaking dangerous records in terms of its extent and intensity. The main countries affected are Bolivia, Brazil, Colombia, Ecuador, Paraguay, Perú and Venezuela. Even countries far from the critical zone, like Uruguay have been impacted by smoke from the fires.
According to Jones et al. (2022), wildfires “are the result of high temperatures associated with climate change and intense droughts that have affected key ecosystems for the planet’s sustainability, such as the tropical rainforest… among others. Human activity may also be related to these fires; however, at these scales, they are characterized by their destructive capacity, rapid spread, and the high unpredictability of their behavior, boundaries, and effects. Despite local efforts, the magnitude of these fires has exceeded the institutional and community response capacities in the region, being devastating for biodiversity, ecosystems, and people.”
While responses to this emergency vary in each country and civil society reacts in different ways, open and participatory mapping initiatives have emerged to contribute to the fight against this situation.
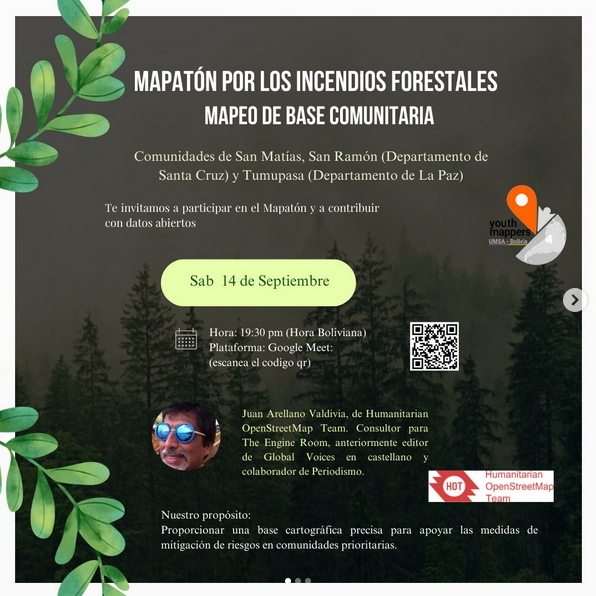 Image from the Instagram account youthmappersumsa.bo
The YouthMappers community at the Universidad Mayor de San Andrés (UMSA-Bolivia) organized a Wildfire Mapathon on August 31. On their Instagram, they commented: “The eastern region of Bolivia, particularly San Matías and San Ramón, has been severely affected by wildfires for about a month. These fires not only impact the local population but also the flora and fauna of the Santa Cruz department, where several hotspots still persist.”
This activity was repeated on September 14, with the participation of our colleague Juan Arellano, Communications and Communities Specialist, who spoke to them about risk management work from the Humanitarian OpenStreetMap Team. UMSA students are conducting these mapathons with the aim of giving visibility to affected communities by highlighting their disaster-exposed infrastructure and the density of human settlements.
Another important effort in Bolivia is led by mapper Juan Jose Iglesias, who is mapping the fire-affected area by taking advantage of the release of new satellite images from ESRI in Bolivia. He observes that where vegetation once predominated, agricultural activity and urbanization now dominate. He also notes the problem that the government primarily uses Google Maps for logistics, information that is very outdated and does not reflect current land use or some towns. He compares this with firefighters from Brazil who are collaborating and using OSMAND PRO on tablets. Lastly, he adds that the area’s data is based on Maxar images from more than six years ago.
In Peru, fires have affected Amazon regions such as Tarapoto, Amazonas, and Ucayali. In the latter, Jonathan Rupire, leader of the OpenStreetMap (OSM) community in Peru, reports that the fires in the area near the Yarinacocha Lagoon have caused significant losses to the crop areas (mainly cassava and bananas) of the communities settled there, as well as losses to reforestation areas.
Taking advantage of his stay and the willingness of the Santa Clara community and local civil society organizations, they are organizing a Burnt Land Registration workshop, to collect drone photos (orthophotos) of the areas burned during the fires. Later, a Wildfire Risk Management workshop will be held, with the participation of the National Intercultural University of the Amazon, ensuring that the materials produced will also be available in some Amazonian languages like Shipibo.
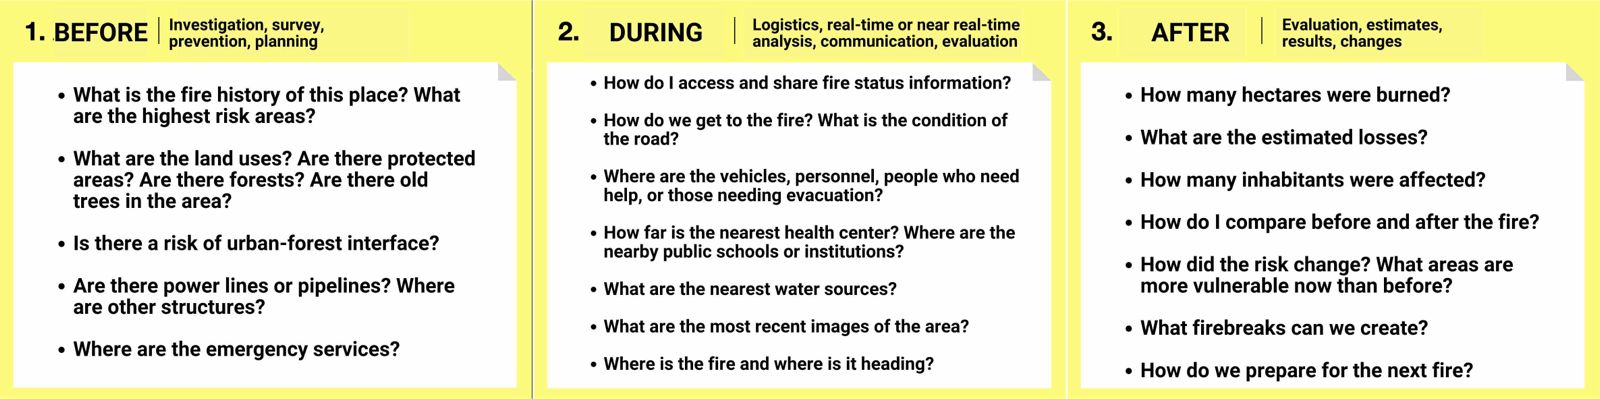
What data to collect when facing a fire
 Emilio Mariscal.
Our colleague Emilio Mariscal, software developer for HOT and volunteer firefighter, says: “Open maps are essential before, during, and after wildfires. They help us in preventive work, facilitate coordinated action during the fire, and aid in post-fire evaluation. They allow us to assess risks, locate our position in relation to the fire, and plan strategies, not only to account for burned hectares and the damage suffered but also to restore forests and help affected people rebuild their lives.”
Emilio also emphasizes that an example of how maps generated by the OSM community are helpful is that “firefighters can now have maps on our phones, even without internet connection, which allows us to move to the fire zone with information that is so valuable it can even save lives. Not just ours because we can know where we are, how to reach the fire, and how to get out, but also the lives of people at risk because it allows us to work more efficiently.”
A clear example of this is the map created by La Granja Firefighters during the fire in La Pampa - San Jorge, Argentina.
Anticipation is key to effectively managing any crisis or challenge. Having updated maps not only allows for better visualization of the territory but also strengthens decision-making in critical situations.
For this reason, we invite you to explore the available open mapping tools, such as the National Mapathons, organized annually in collaboration with the Space Agency and AmeriGEO. These activities not only encourage community participation but also generate valuable data for humanitarian management and development.
The annual recurrence of wildfires requires prevention efforts and training, which few organizations are addressing. We encourage both community leaders and civil society organizations to dedicate efforts and resources to this issue, which we are ready to support through open mapping.
Furthermore, we encourage you to use the OpenStreetMap Export Tool, a simple tool that allows you to download updated geospatial data for use in your planning and management efforts. Here you will find a
brief usage guide, so that you can implement this information in your planning and response activities.
Other Resources:
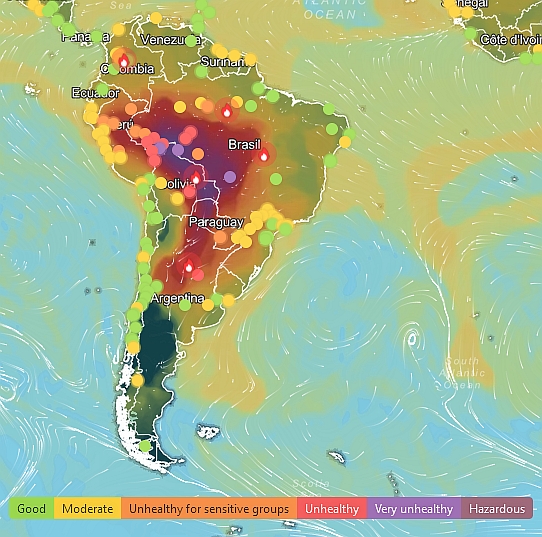
- Windy: To monitor air quality
- IQAir: Also monitors air quality
- Firms: To monitor hotspots
- EO browser: To compare satellite images as support