On the Front Line of Climate Change: End-to-End Open Mapping Tech for Wildfires
Posted by Emilio Mariscal • Sept. 11, 2024
Climate change has led to an increase in wildfire season length, wildfire frequency, and burned areas around the world. The wildfire season has lengthened in many areas due to factors including warmer springs, longer summer dry seasons, and drier soils and vegetation. Given this context, people from the Alpa Corral region in Córdoba, Argentina, who want to protect our native forests and towns, met from July 26 to 28 to see how the Humanitarian OpenStreetMap Team’s End-to-End Open Mapping Tech can help people prepare themselves to face disasters together.
Cover image by Daniel Bellomo
The End-to-End Process
In the small town of Alpa Corral our team coordinated with the local government, fire stations, civil society organizations, and people from the area to test the Humanitarian OpenStreetMap Team's (or HOT) End-To-End process for creating rich, high-quality maps. These maps, together with open knowledge of how to use them and keep them updated, are key for government and civil society preparedness in the face of disasters like wildfires, whose effect on communities can be devastating.
This is the process that we followed, using tech tools that are available to everyone for free.
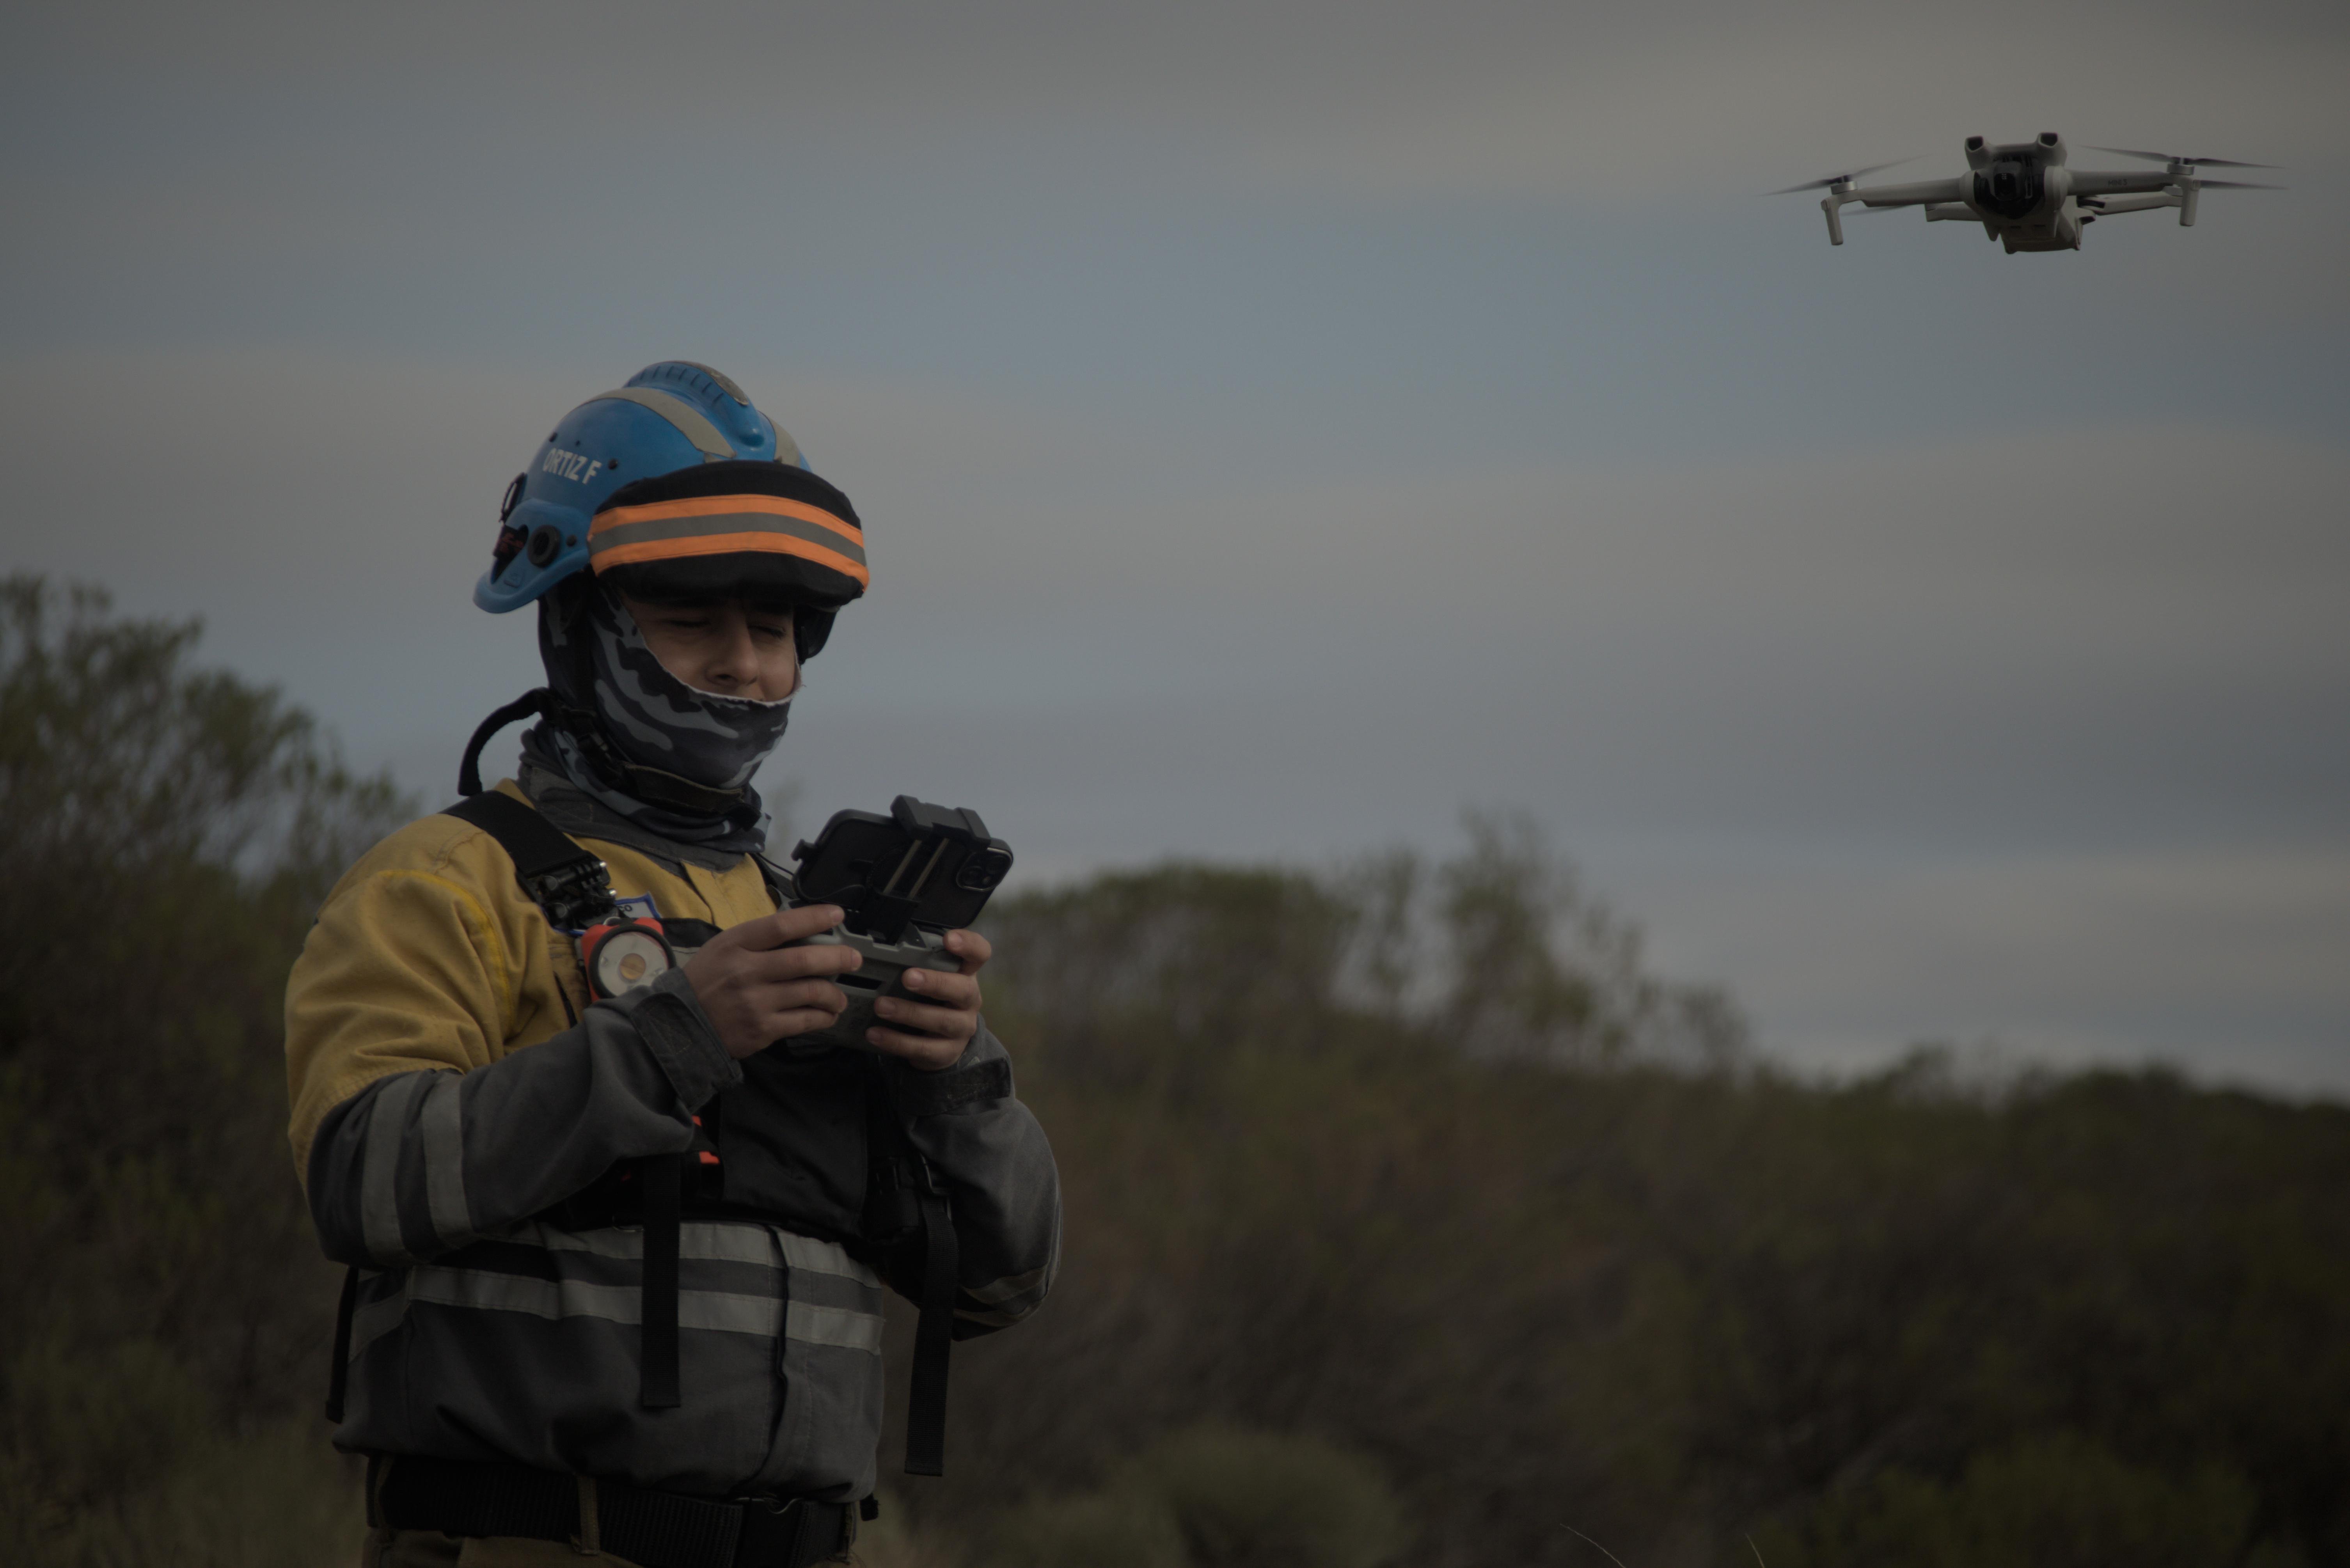
 Preparing for drone flying, photo by Ignacio Mariscal
Creating our own aerial map
Because the available free satellite imagery of the area is not in high resolution and is not up-to-date, we created our own aerial imagery using drones. We started by defining the area of interest in accordance with the needs of the people and forest protection institutions. Also, this was where a previous big fire moved towards the urban area.
Then, the pilots went to fly, and it went great! 10 people were able to capture images using different models of drones, most of them flying at the same time. The main challenge was to cover the assigned area. Most of the pilots covered part of it, but they ran out of battery, or they flew partially over other areas.
In the near future, we aim to address these issues using the Drone Tasking Manager, which will facilitate the creation of tasks and the configuration of drones with precise flight plans for each.
All captured images were processed and then published as a browsable aerial map into OpenAerialMap, an open collection of aerial imagery co-developed by HOT.
Mapping all the buildings
We then moved to map buildings, because it’s easier than to map other features like forests or highways. In order to map in a collaborative and organized way, we created a HOT Tasking Manager project, dividing the area in a grid of tasks that each mapper could take. People mapped together 1466 buildings in what we call a mapathon.
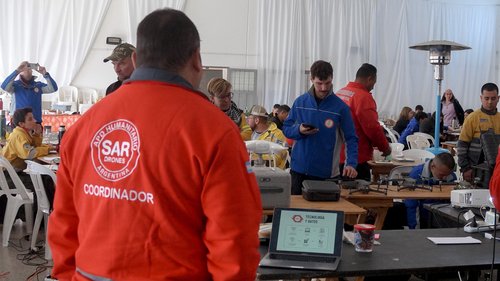
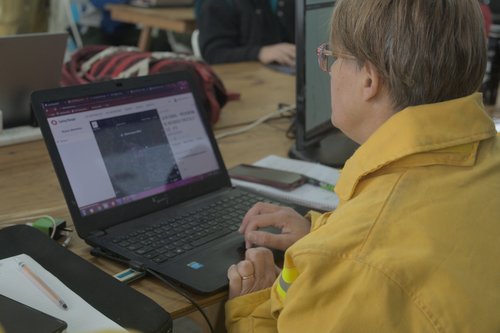 Remote mapping with Tasking Manager, photo by Daniel Bellomo
During remote mapping, people drew polygons for each building manually over satellite or aerial imagery when this was available. At HOT, we’re currently working on a way to make this work more efficient, taking some of the mapped buildings and creating an AI model for mapping the rest. During the workshop we did a quick demonstration of the product that we’re developing to achieve this goal in the near future: fAIr.
Adding details to the map
Remote mapping is not enough to have a full map because there are things that can’t be seen from above. To identify what type of building we’ve mapped (house, emergency service, commercial, etc.) and add more details like the name of the place or the building material (something very important for addressing fire risk) we have to be in the field.
To add local knowledge to the data, we created a project in the HOT Field Mapping Tasking Manager (FMTM), with a grid of tasks and a customized data collection form that was then used with a field data collection app (ODK Collect) in order to enrich the previously mapped buildings.
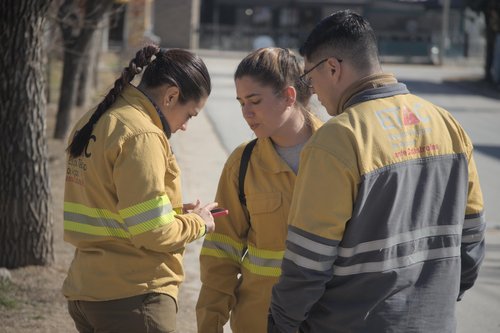 Adding local knowledge with Field Mapping Tasking Manager, photo by Daniel Bellomo
Obtaining all the data
We used the HOT Export Tool to download the previously mapped data into our computers. Also, we downloaded field mapped data from HOT Field Mapping Tasking Manager and offline maps for having on our phones, using OsmAnd and Organic Maps.
Put the map to work
Having open data, open technology, and knowledge about how to use it, we were better prepared for disasters. And a disaster happened!
Luckily it was all fiction: a wildfire drill!
Lots of people went outside to fight the fire, while others stayed inside, getting information and making decisions.
We prepared the scenario in the field days before, adding color marks for hot spots (red = fire; yellow = no fire, but hot; green = no fire, cold) and evacuation (red = people not evacuated, green = people evacuated). We also had a secret plan (it was not disclosed to everyone, only some event organizers knew) for how the incident should develop.
 Looking for buildings in risk during the wildfire drill, photo by Daniel Bellomo
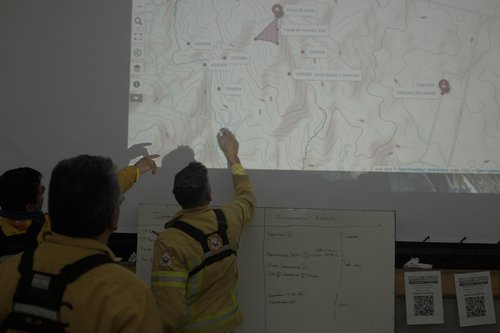
Once the drill started, we organized following an ICS (Incident Command System), something that’s very common in disaster situations. The ICS is a "top-down" management system for incidents widely used across the world.
As part of the ICS, I was in charge of the Planning section, managing a group of people in the Geographic Information Systems (GIS) and unmanned aerial vehicle (UAV) sub-sections (~14 people with laptops). During the incident, we received data from the Communication sections (via WhatsApp and Very High Frequency -VHF- Radio), and we were asked by the Incident Commander for maps and information about what was happening.
We decided to create a map using uMap, with the up-to-date OpenStreetMap map as the background and all the previously mapped buildings included, plus local knowledge data produced during the field mapping activity. It was displayed using a projector in the room and on the laptop screens of several people. We chose uMap because it was the easiest way to create an online map together.
We continuously added data: coordinates of the fire area, crews, vehicles, access points, mapped buildings (remote and field), danger zones, structures at risk, evacuation areas, Points of Interest (POIs), tracks, etc. Aerial imagery was also available.
The GIS team created incident reports for sharing with the media and the UAV team also sent some videos from the field.
Data collected in the field was added to the map, mostly in the following way:
- Crews transmitted data (coordinates and information) from the field using VHF radios.
- The Communication section received it and added it to a log sheet (an online spreadsheet).
- The Information section shared the news to the GIS Officer, who then asked a GIS Operator to create the data to be published.
- The GIS Operator in charge of publishing the data added it to uMap.
- The Information Officer shared the news with everyone using the projector screen.
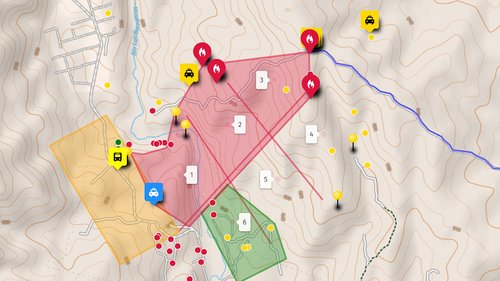 Resulting map as displayed in uMap.
Thank you, people
I’m a volunteer firefighter myself, with experience in big fires that can last weeks. I have been creating maps for wildfires, especially after they happen. This was the first time I saw something like this. All these people working together, with clear information about the incident, displayed in almost real-time on a big screen, it was like a movie! I really hope that we can continue working together and implement this kind of end-to-end process, using open data and technology before, during, and after disasters.
Working in this way not only gives people and institutions useful tools, but also gives everyone the opportunity to contribute, in a safe and efficient way, to face disasters like wildfires.
Thank you everyone for being part of this amazing community of people working together for a better world.
Share