News — 26 September, 2024
Export Tool Update: New vector tiles format and improved metadata
For over 15 years, the Humanitarian OpenStreetMap Team (HOT) has been helping users access OpenStreetMap (OSM) data through the Export Tool, an easy interface that allows downloads in popular spatial data formats. This week we introduce two new tile formats and the ability to get User Info + Timestamps.
The OpenStreetMap Export Tool, is a simple tool that allows you to download updated geospatial data for use in your planning and management efforts. Here you will find a brief usage guide.
As time passes, the preference of map data users towards new or different formats changes. Based on our analysis of trends and potential users, HOT has been changing and improving its offering consistently. For instance, on the last iteration of the Export Tool 6 months ago, HOT introduced three new formats (FlatGeobuf, CSV, and SQL), as well as metrics and performance improvements. This week, we introduced two new formats (MVT and PMTiles) and the possibility of exporting or including metadata elements like timestamp and user information. Let’s take a look at it:
1) New formats and their uses: PMTiles and MVT
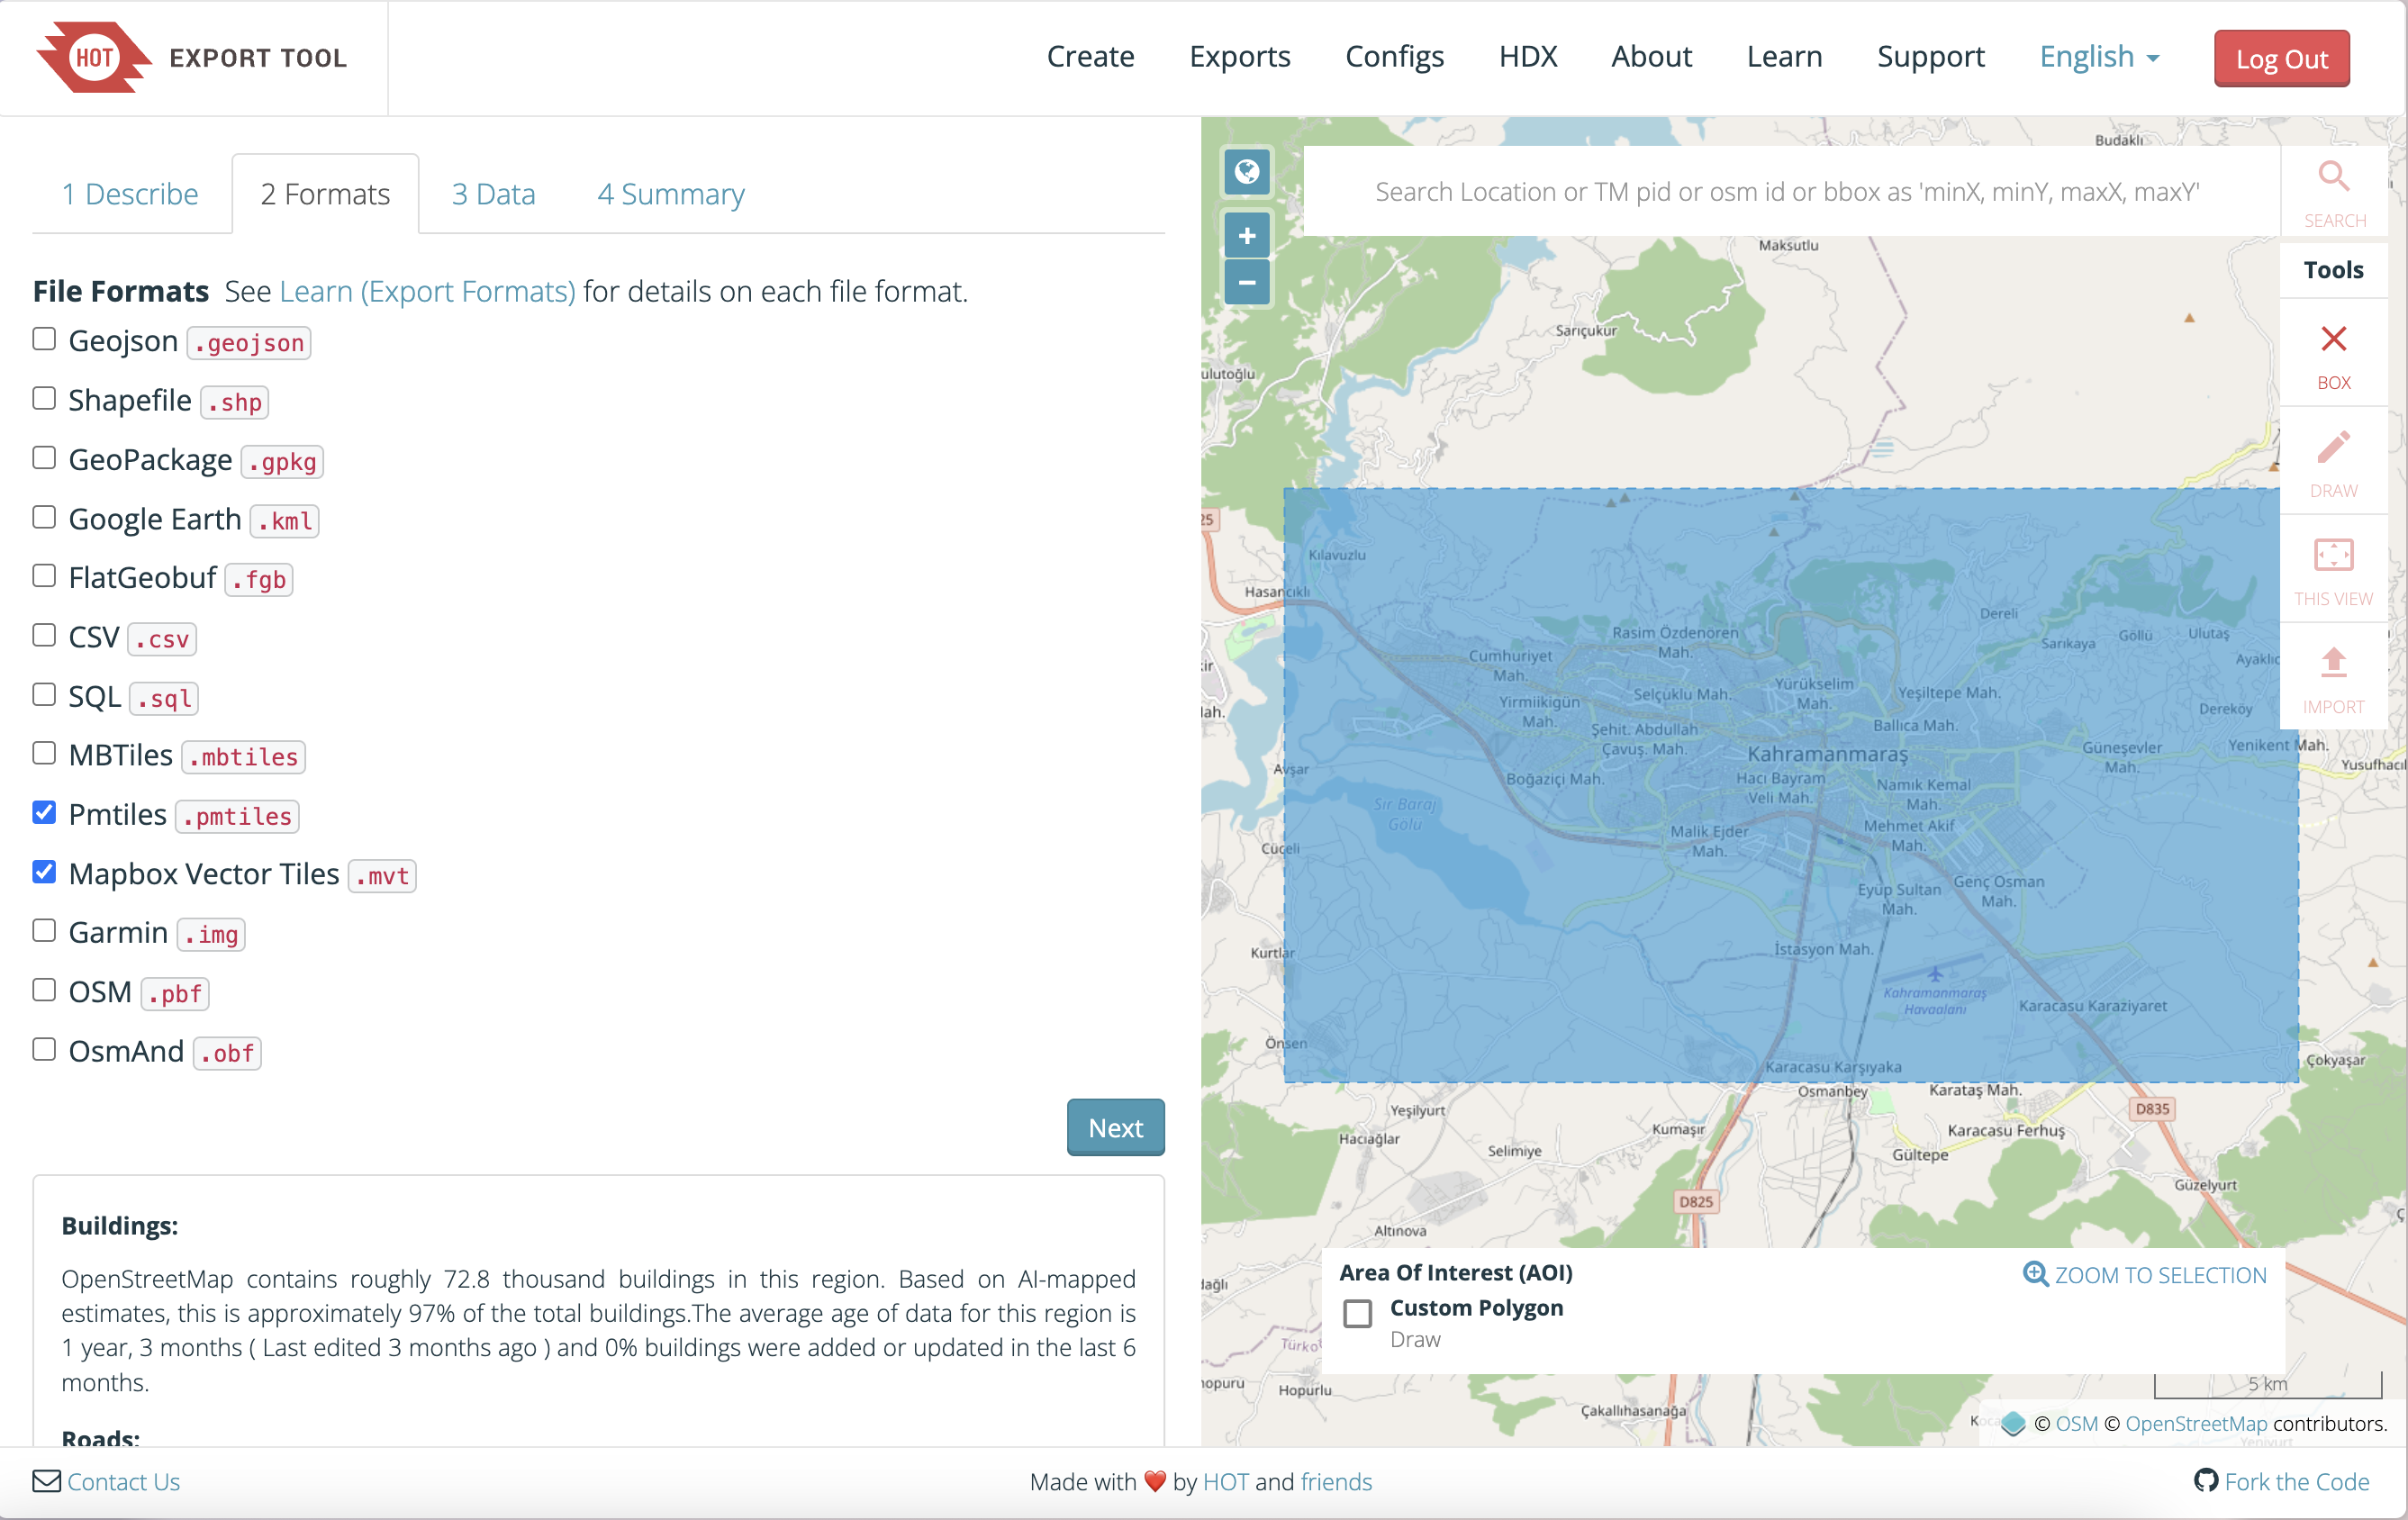 Image depicting the checkboxes that need to be selected for the two new formats on the OpenStreetMap Export Tool
One of the tile format’s unique advantages is that they are optimized for web-based maps and displaying large datasets in an efficient way. Unlike GeoJSON or Shapefiles, which are often better suited for smaller, more static data sets, tile formats break data into smaller, easily loadable pieces. While formats like GeoJSON and shapefiles are great for analysis and data sharing, tile formats excel when it comes to displaying large amounts of information quickly in, for instance, interactive maps, which can be really helpful to give context and support a given visual narrative.
PMTiles and MVT in general are praised for their scalability, dynamic loading and flexible styling
- PMTiles. Because it is a single-file archive format for pyramids of map tiles that allows for efficient storage and retrieval of map data, this option is worth exploring for those looking to work with large amounts of static data or offline applications. In the humanitarian context, the ability to consolidate all vector data into a single file for offline use is extremely valuable for specific applications, particularly for those to be used in rural areas or regions affected by disasters where internet access may be restricted.
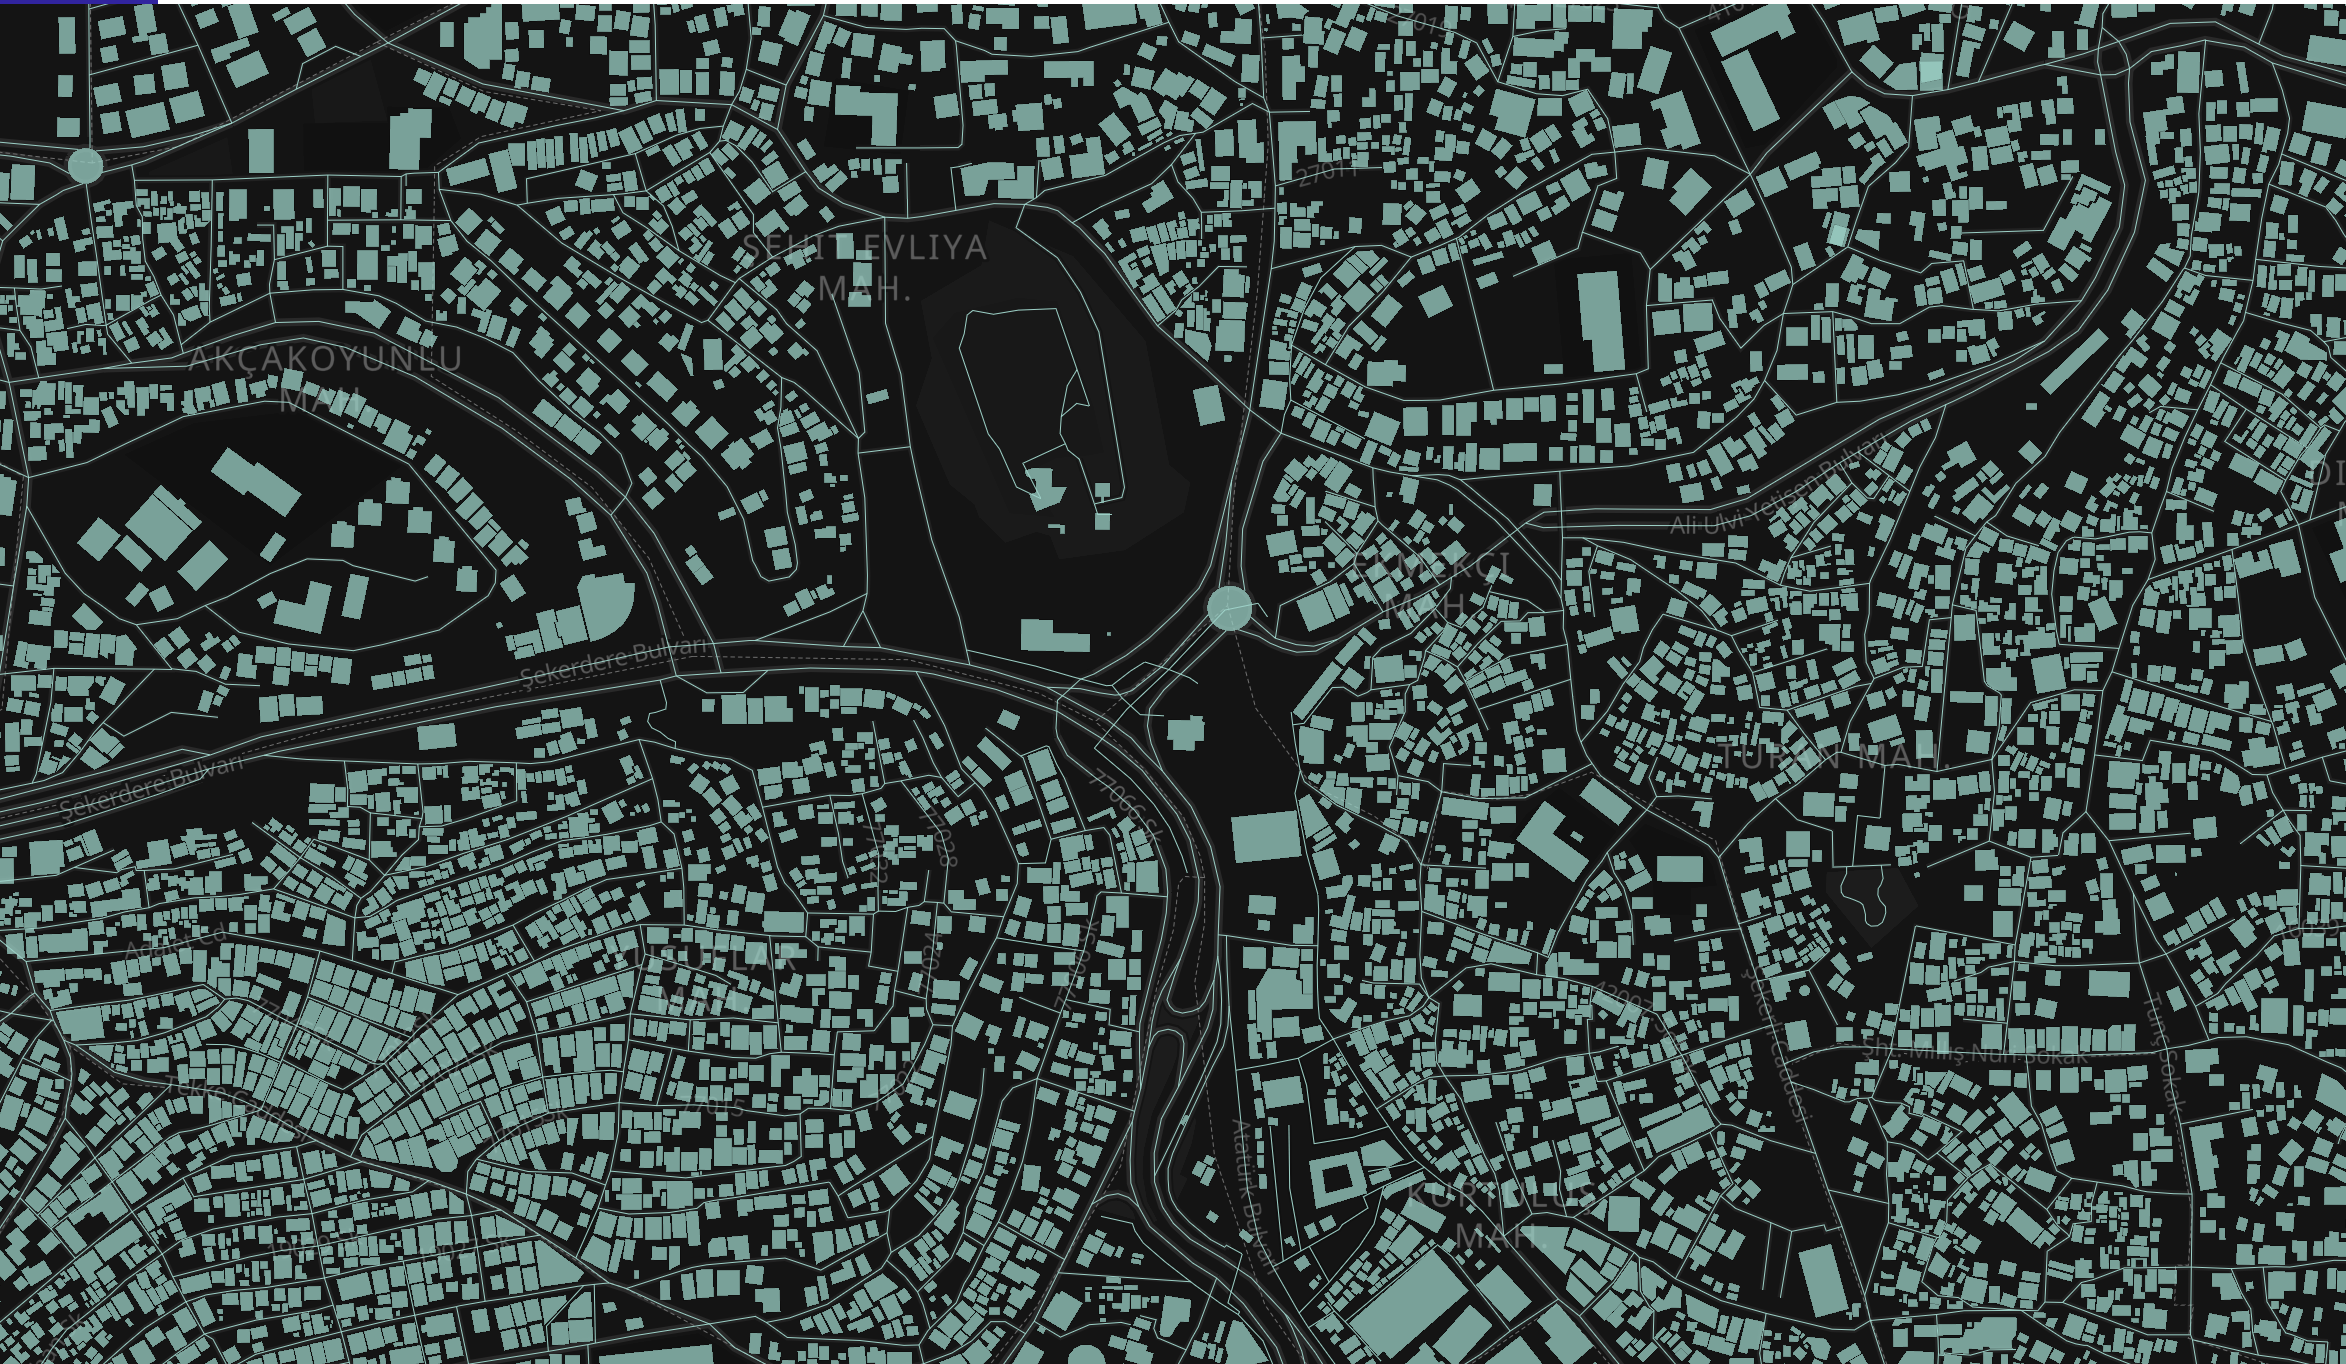
Example use of PMTiles
Interactive map using PMTiles from Export Tool to render buildings and destroyed buildings from OSM. These buildings were mapped as part of a the Turkey Syria Earthquake campaign in 2024 to identify affected buildings.
- Mapbox Vector Tiles (MVT). This format is optimized for efficient rendering but focuses more on dynamic styling and interactivity, making it ideal for applications that require data visualization. Its compatibility with popular mapping libraries like MapLibre (or Mapbox GL) further enhances its versatility for developers creating mapping applications. In the humanitarian context, this format could serve as the backbone for an application tracking damaged infrastructure from natural hazards, enabling data visualization, efficient rendering, and dynamic styling (for instance displaying damaged structures in different colors).
2) New Features: Metainfo
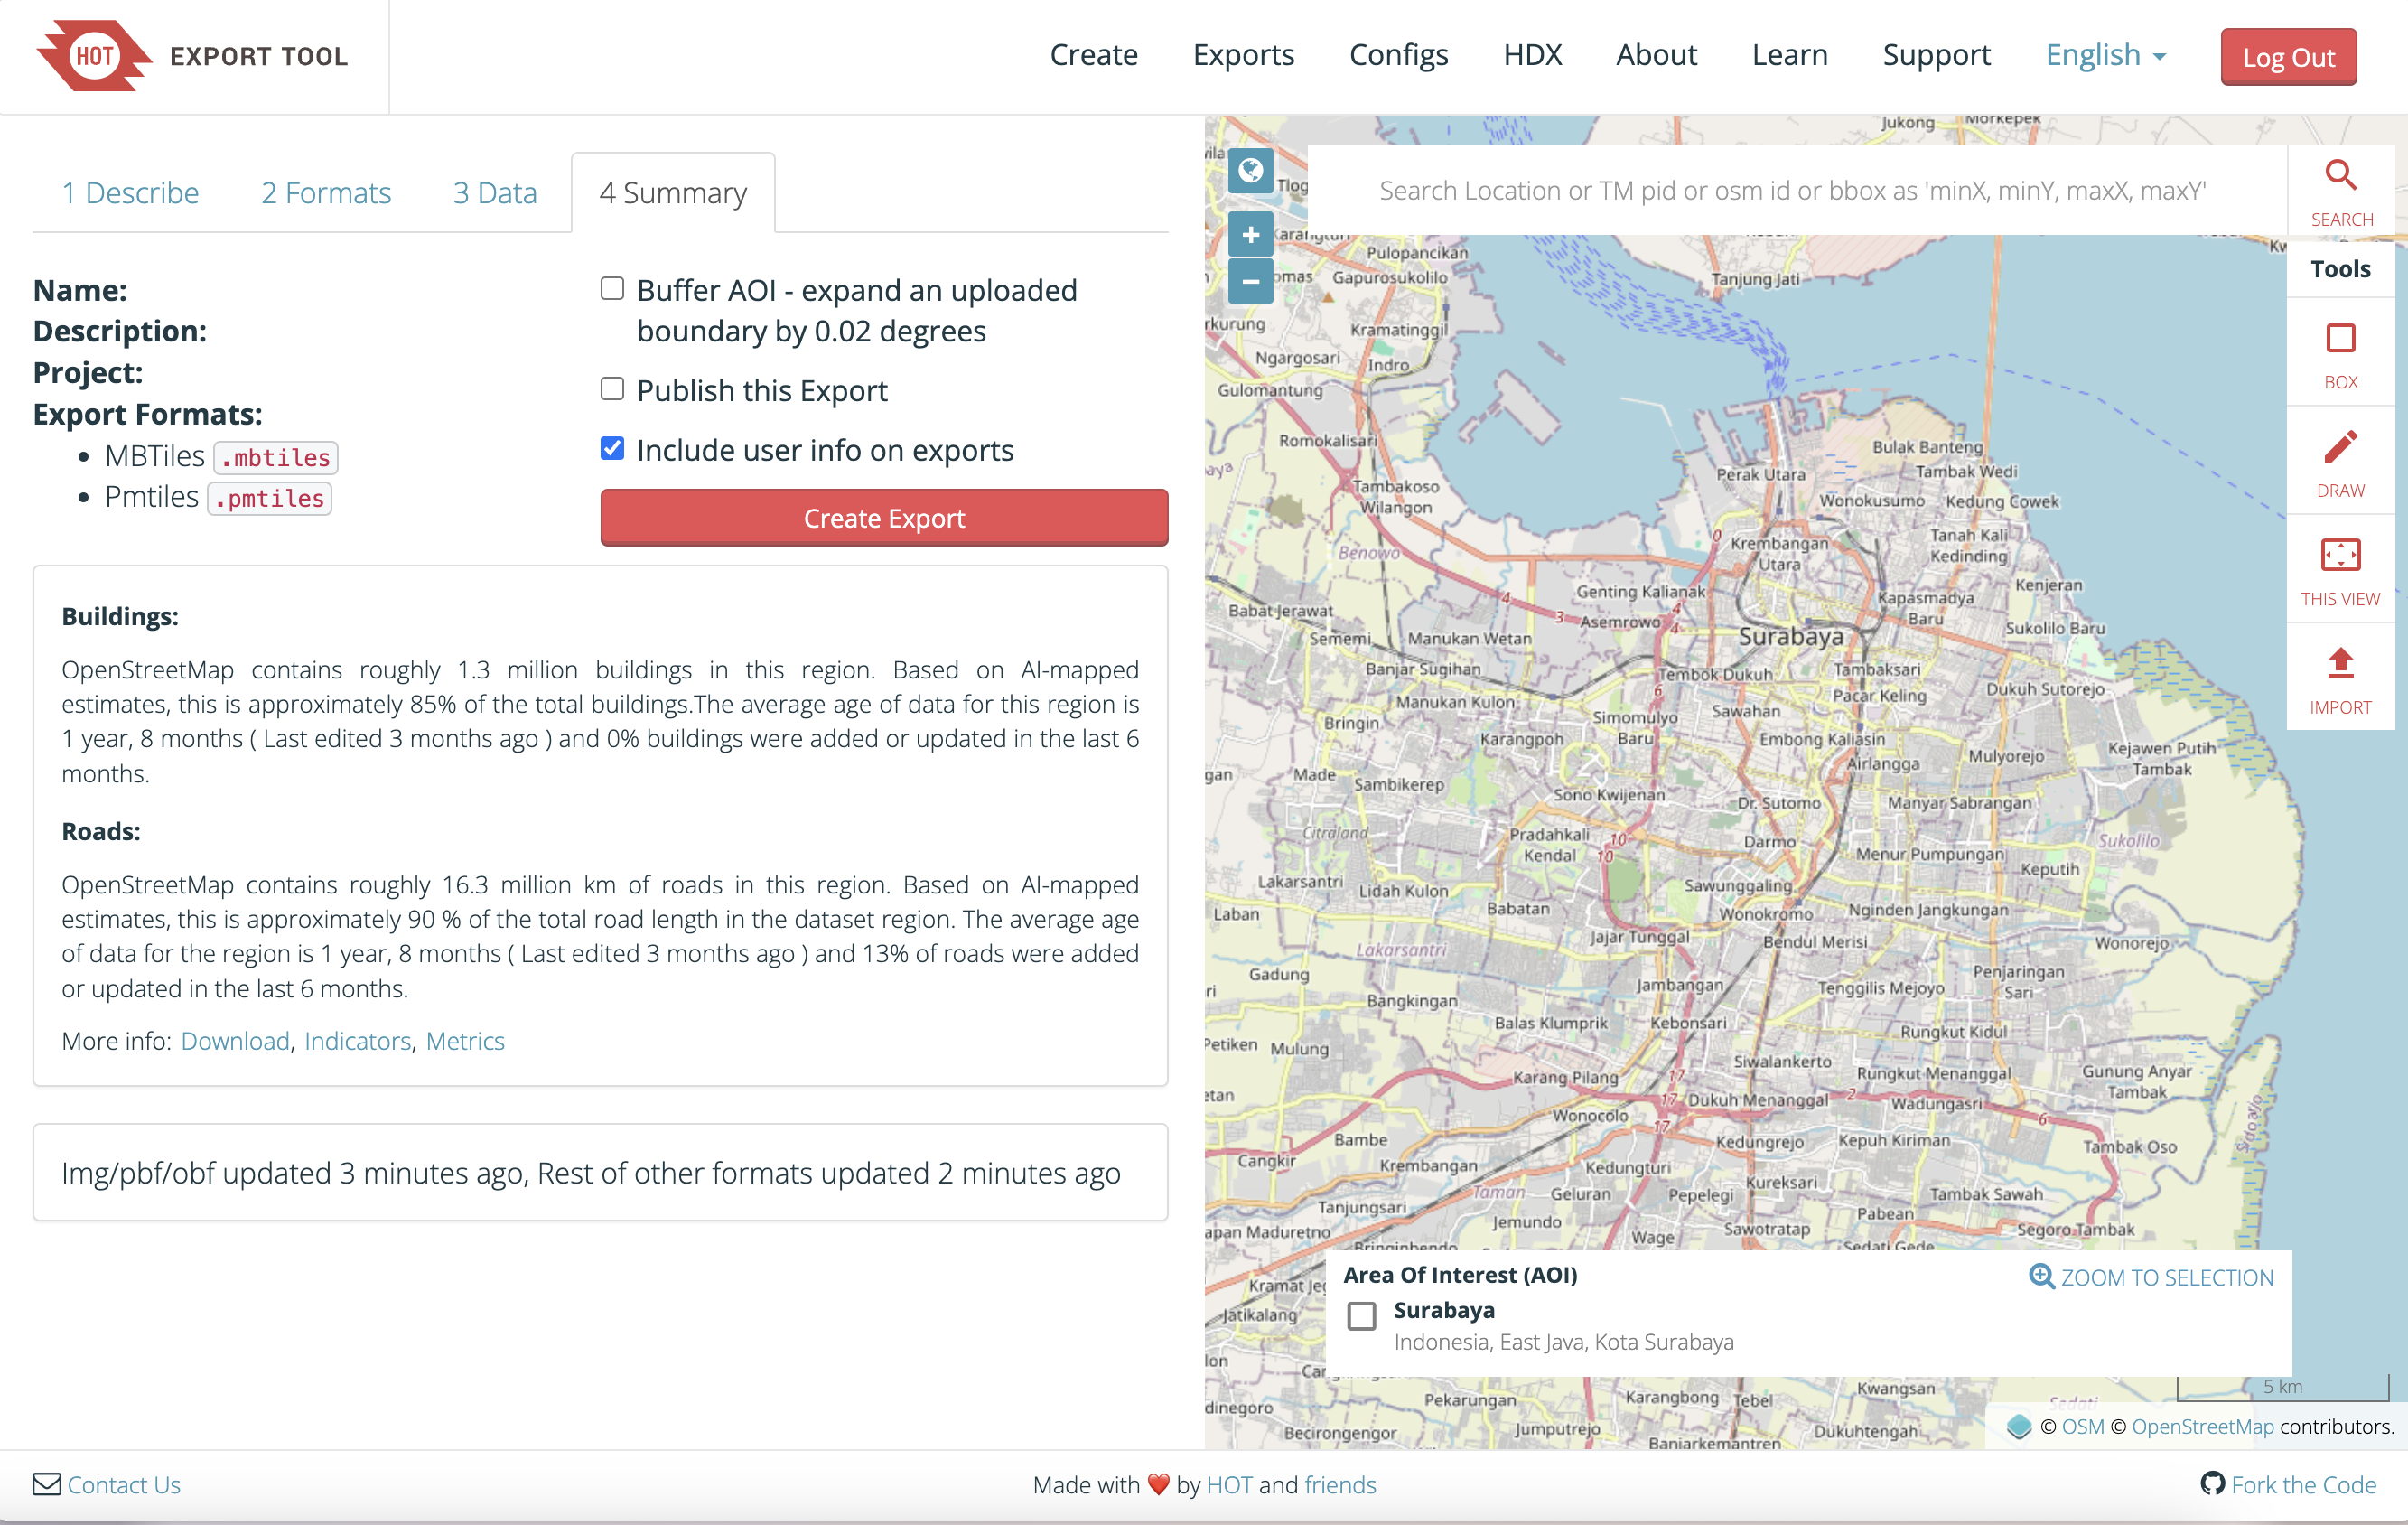 Image of the Export Tool showing how the checkbox to include user info and timestamps on your export.
Directed by user feedback, we have incorporated more metadata and metrics into our exports as part of our data transparency efforts. Our aim is to help users go beyond simply using the data by enabling them to better understand its context (metadata) and limitations (metrics). These insights can help them choose the right methodologies for their analysis, leading to more transparent outcomes. Following the trend of our past post announcing metrics, this time we bring two new features:
- Version and changeset, timestamp format:
“osm_version”: “integer”,
”osm_changeset”: “integer”,
”osm_timestamp”: “Date (ISO 8601 format)”
Despite introducing metrics like “average age of data” and “last edit”, users gave us feedback that they wanted more personalized insights into how the data was being created by OSM contributors–metrics of the type that the now unmaintained OSM Analytics was producing. Having timestamps allows you, for instance, to look at mapping on a given area and look for day or time trends; you can make visualizations that show change over time; you could analyze the frequency of edits in specific regions to identify areas where data was created very fast or slow, which might mean quality issues due to carelessness or difficulty.
Although there are other ways of extracting metadata from OSM, these tend to be more limiting and difficult for those who are not familiar with it. Having the data readily available will prompt more people to look into it. However, this does not include the whole history of a feature, but rather its last changeset.
Example use of User Info and Timestamp
 Graph showing “summer-lows” in mapping activity from the Benjamin Herfort Blogpost on tracking Tasking Manager Usage
- User Info format:
“Osm_user”: “String”
The “osm_user” metadata provides valuable context about who contributed to the mapping data. This information can be leveraged to analyze contributor activity and engagement levels within specific areas. By tracking user contributions, you can identify active mappers and assess their impact on data quality and completeness. For instance, visualizations could highlight regions with high contributions from specific users, allowing for targeted outreach or support to enhance mapping efforts. There are some caveats too: while user information is readily accessible, it is essential to note that it reflects only the most recent contributor and does not provide a comprehensive history of all edits made to a feature. Also, it is important to note that given the sensitive nature of this information, it will only be provided once a user is logged in to the Export Tool and agrees to our data use and protection disclaimer.
Example use of User Info and Timestamp with spatial element
 *With the user info and timestamp, you can identify the amount of contributors and the time of their contribution. In this example, HOTOSM Indonesia
shows the mapping pace and location over a period of time for a campaign ins Surabaya in 2016 by *
*With the user info and timestamp, you can identify the amount of contributors and the time of their contribution. In this example, HOTOSM Indonesia
shows the mapping pace and location over a period of time for a campaign ins Surabaya in 2016 by *
Conclusion
The introduction of two new vector tile formats, PMTiles and MVT, marks a significant advancement in HOT’s commitment to enhancing spatial data visualization and application development. These updates allow users to customize vector tiles by selecting specific features—such as roads, buildings, or land use types—and attributes for export. These elements can then be rendered and styled dynamically, giving users greater control over how the tiles are displayed in their applications, maps, and visualizations. Additionally, improved metadata features, such as timestamps and user information, provide deeper insights into the data, fostering a better understanding of mapping trends and contributor activity.
As always, we would love to hear from you and what you think of these new developments! We would also welcome contributions from people to improve the Export Tool documentation here. Join the #export-tool Slack channel or get in touch with Kshitij / Tech team if you have any questions or want to send a note of appreciation!
Other Resources:
- Protomaps: “An interactive, customizable and open source map of the world, delivered as a single file hosted on cloud storage.”
- Protomaps Docs: “Protomaps is an open source system for interactive web maps, like this one:”
- PMTiles Viewer: “Inspect and preview PMTiles local or remote PMTiles archives.”
- protomaps-leaflet: “Complete vector tile renderer”
- HOT Toolbox: Creating MBTiles for ODK Collect (raster)