Mapping for Climate Ready Cities - Dhaka Thrive
Climate Ready Cities • Bangladesh
Through our Mapping for Climate Ready Cities program, HOT is supporting the development of a thriving ecosystem focused on the creation, interpretation, and use of maps to respond to and reduce climate risks in urban areas across four priority regions. This project page highlights our work in Dhaka, Bangladesh through HOT's Open Mapping Hub - Asia-Pacific.
Climate Vulnerabilities in Dhaka
Dhaka is one of the fastest-growing megacities in the world. With rapid urbanization and growing migration, Dhaka confronts unique challenges in population density and the rapid expansion of informal settlements, resulting in makeshift communities and poor urban planning.
These areas are highly vulnerable to climate hazards like urban flooding, fires, disease outbreaks, and urban heatwaves. This is further compounded by poor housing and limited access to healthcare, WASH (water, sanitation, and hygiene), and waste management.
Dhaka Thrive: Data-Driven Insights for Climate Resilience and Urban Development
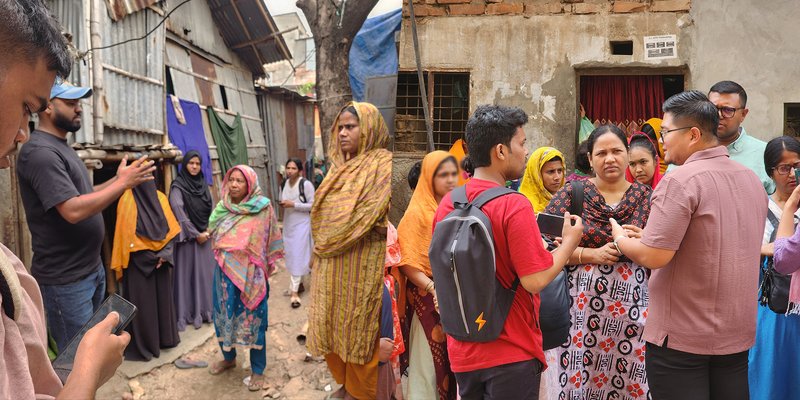
Field visit and data collection in Duaripara, Mirpur (March 2024) | Photo: Honey Fombuena / Open Mapping Hub - Asia-Pacific
To address these complex urban issues, HOT's Open Mapping Hub - Asia-Pacific (AP Hub) partnered with World Vision Bangladesh to launch Dhaka Thrive – an initiative focused on improving access and availability of open geospatial data in Dhaka’s informal settlements.
By mapping critical features and establishing a comprehensive geospatial data, Dhaka Thrive provided deeper insights into the community’s needs and challenges, including climate risks and vulnerabilities, access to basic amenities, and patterns of settlement.
These insights enable governments, NGOs, humanitarian organizations, policymakers, and communities to make informed decisions, helping improve lives and address urban challenges. They also serve as a necessary foundation for stronger, more systematic urban planning in the future.
Mapping Approach
– Phase 1 (2024): Mapping in Mirpur, North Dhaka
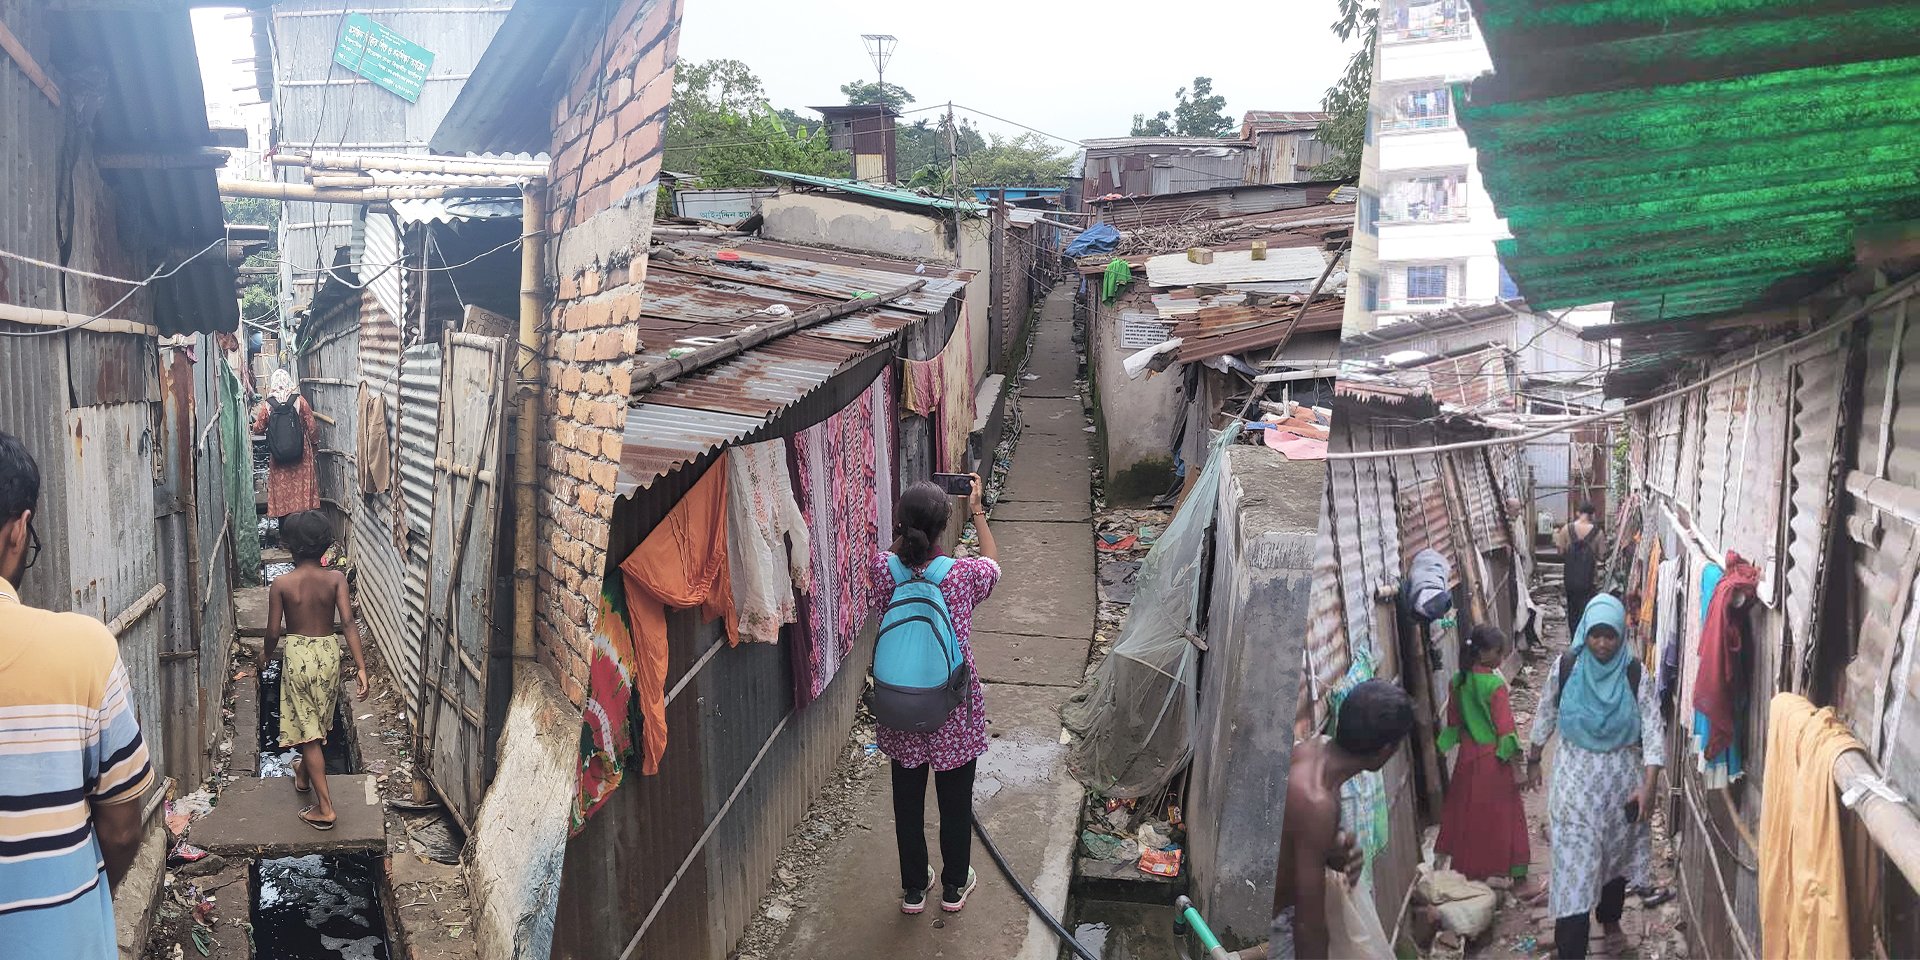
Field mappings conducted by local teams, mostly composed of youths (September 2024) | Photo: Dhaka Thrive field team
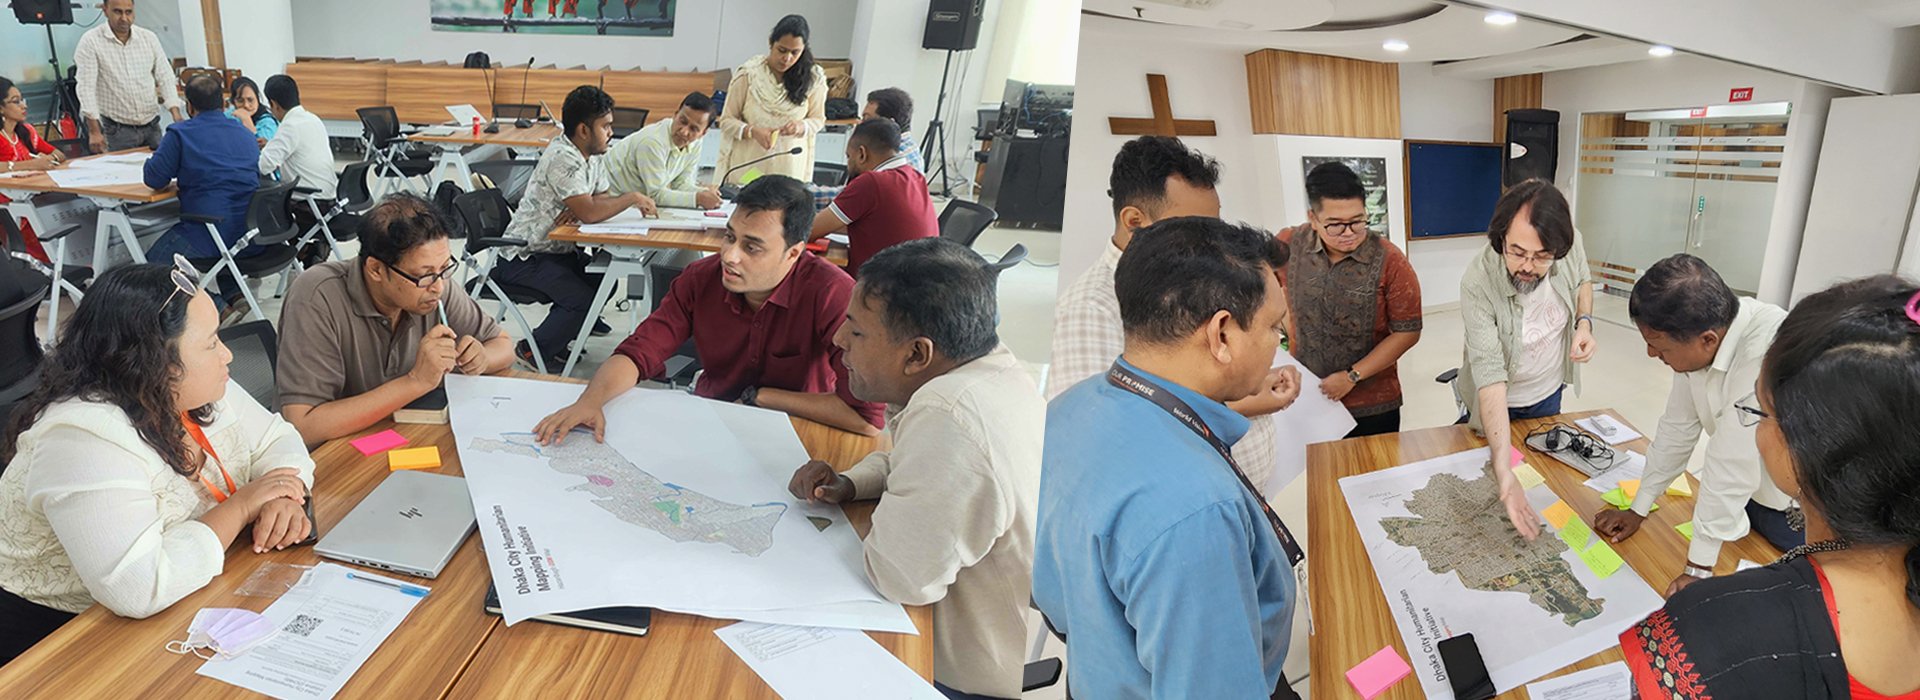
Prior to the mapping activities, in April 2024, a co-creation workshop was held with World Vision Bangladesh and local stakeholders to understand local needs and context. This workshop helped shape strategic direction and mapping priorities for the entire pilot phase of the project. | Photo: Can Ünen and Honey Fombuena / Open Mapping Hub - Asia-Pacific
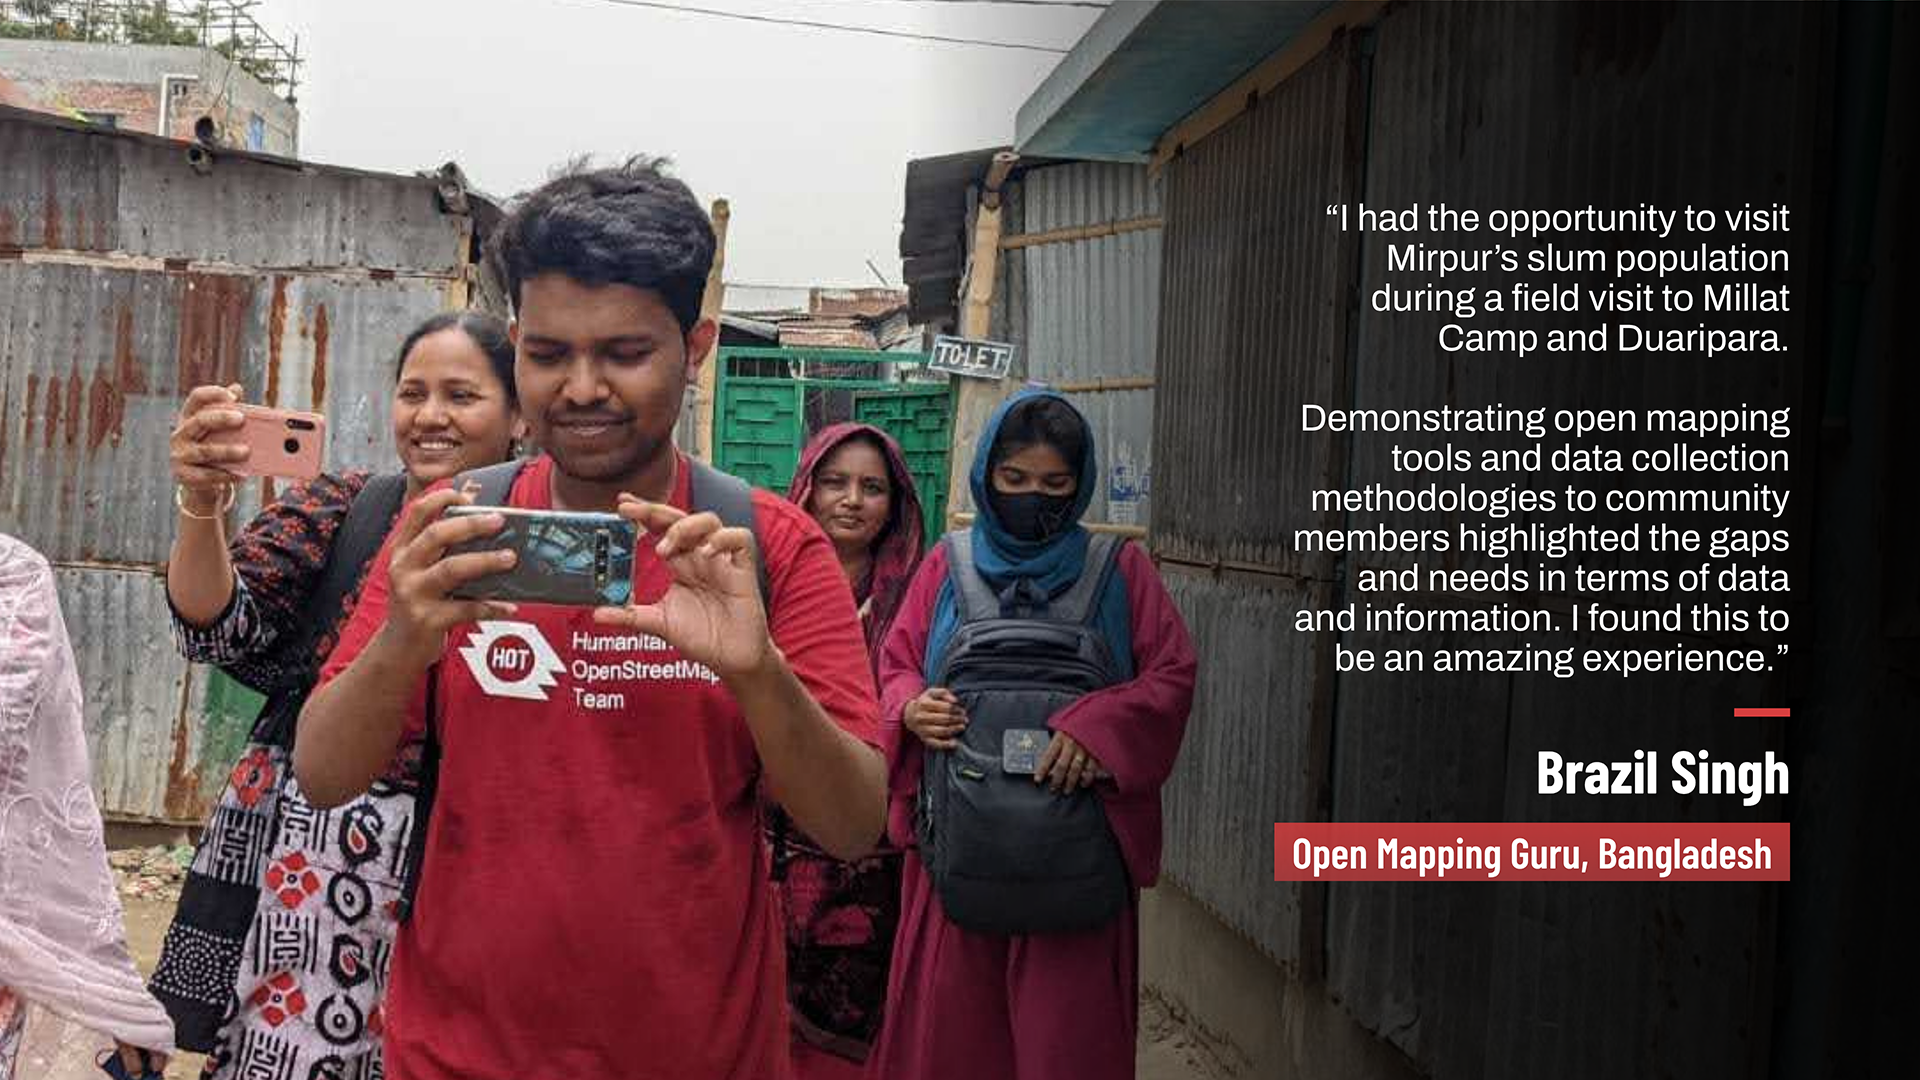
The initial phase of the project focused on Mirpur, a densely populated area in North Dhaka with a high number of informal settlements and climate migrants. Activities included remote mapping and validation, use of local data sources such as public datasets, and field mapping and data collection.
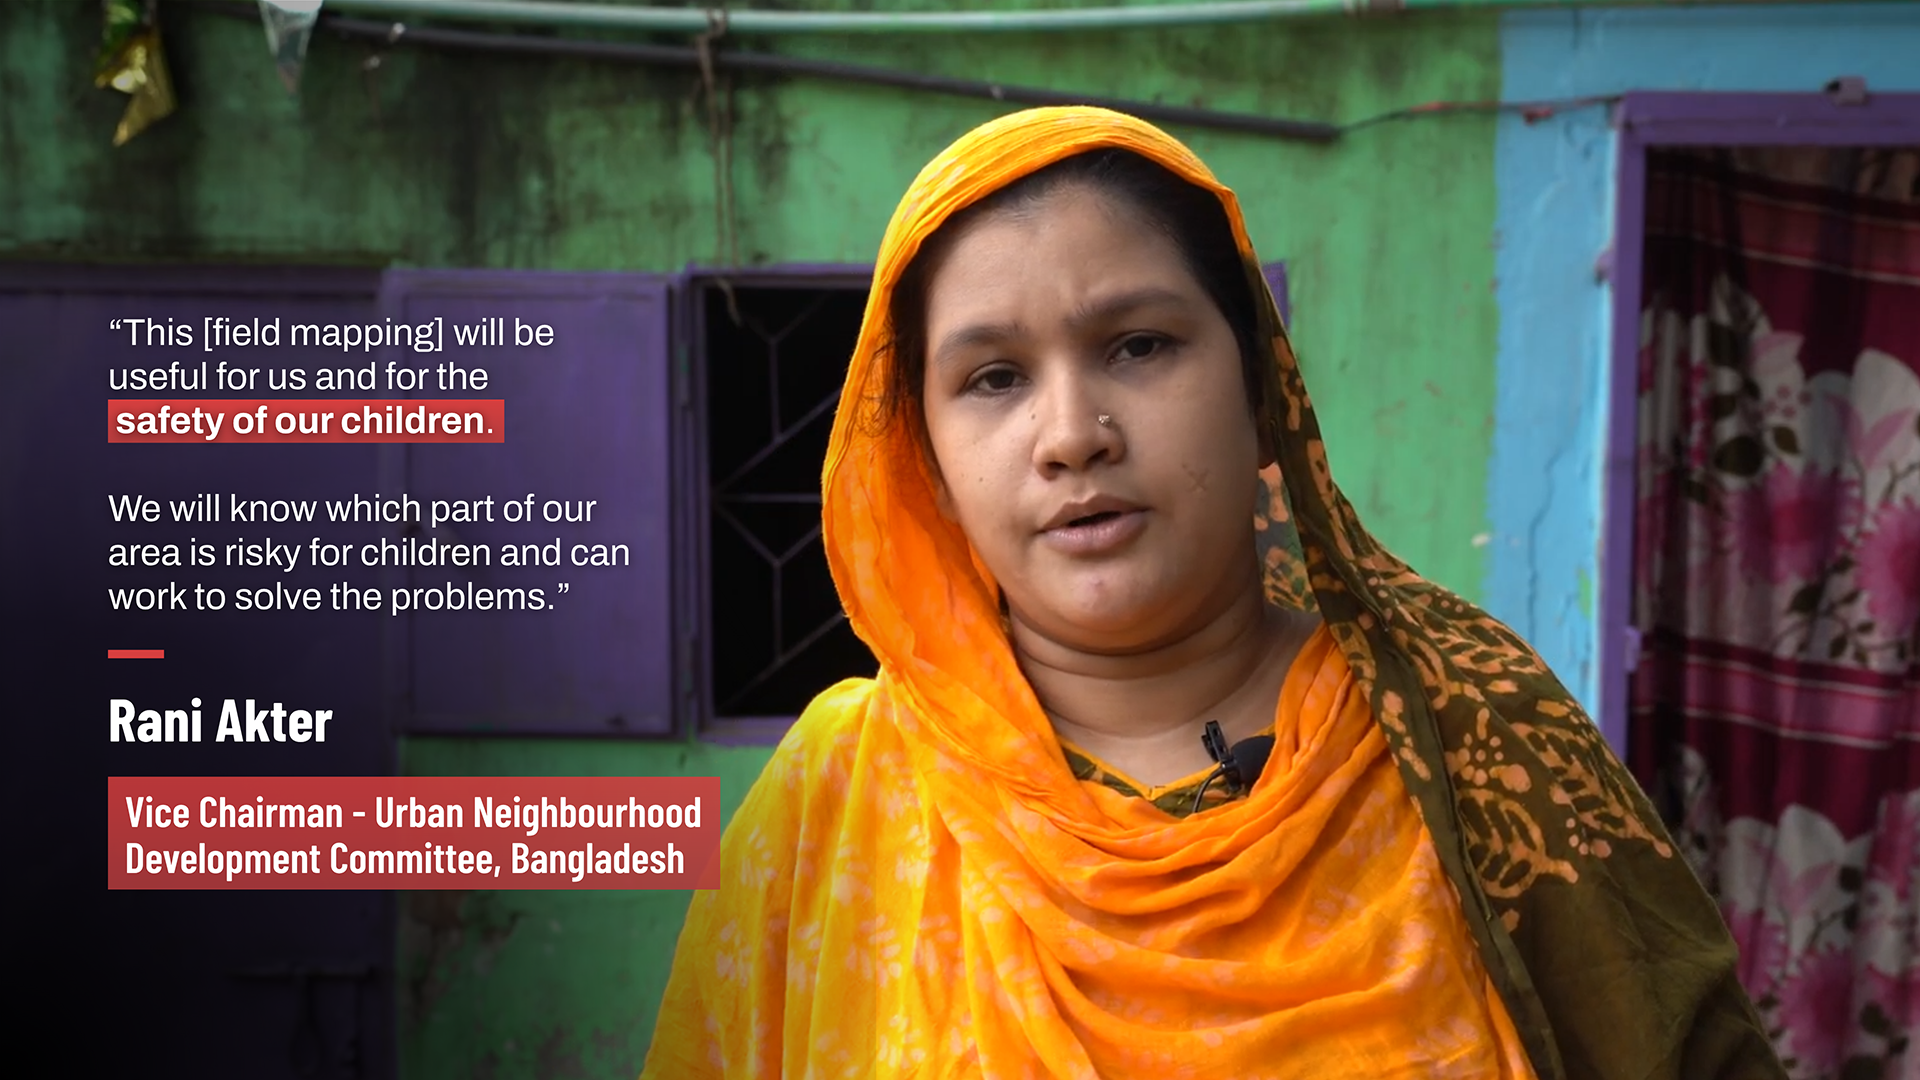
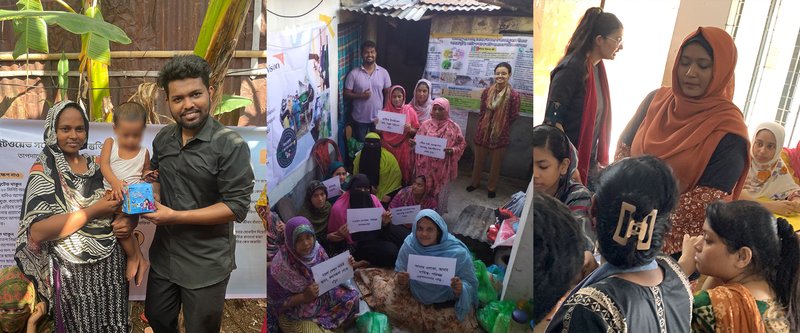
At the field, in addition to collecting data, the teams actively engaged with community members to raise awareness about Dhaka Thrive, ensuring they are informed on how open data can benefit their communities.
– Phase 2 (2025): Turning Data Into Actionable Insights
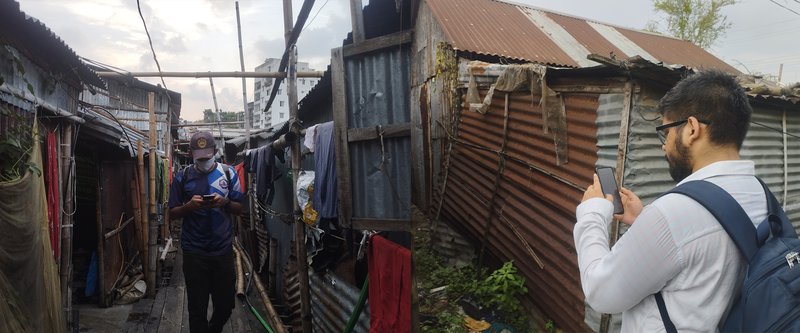
Participants of the Dhaka Thrive Challenge mapped hazard points and critical facilities using KoboToolbox and captured street-level imagery using Mapillary (August-September 2025). | Photo: Abu Syed Al-Imam
In 2025, the focus shifted on transforming insights into action – empowering local communities and decision-makers to drive meaningful, data-informed change. This was achieved through:
- Scaling and local community engagement through the Dhaka Thrive Challenge. Through this open call, community members participated in an eight-week field mapping challenge, both within and beyond the areas mapped in 2024.
- Documenting data use cases to showcase how collected data can be applied across various urban and climate resilience contexts.
Outcomes and Impact
Throughout its implementation, Dhaka Thrive achieved the following:
- Mapped and validated critical urban infrastructure, including buildings, roads, and basic amenities.
- Developed a multi-hazard vulnerability assessment by integrating community-led data with remote sensing, enabling comprehensive understanding of local risks.
- Provided data-driven insights that can be used by policymakers, humanitarian organizations, and community members to design targeted resilience interventions.
Explore the Dhaka Thrive Dashboard
The dashboard showcases three primary datasets:
- Hazard points and layers – Areas with high climate hazard risks, including flood, dengue hotspots, and fire
- Critical lifeline facilities – Community centers, healthcare, educational institutions, places of worship, water, WASH, and waste management
- Detailed statistics and boundaries for each 40+ settlements, with a link to access the street-level imagery via Mapillary
Built using the open-source uMap tool, the strength of the Dhaka Thrive Dashboard lies in its seamless integration with OpenStreetMap (OSM). This allows data synchronization and real-time updates whenever local stakeholders contribute to or update data on OSM.
Learn more about the dashboard through this infographic.
Putting Underrepresented Communities on the Map
Through data collection and local engagement, Dhaka Thrive enriched existing maps of Dhaka's informal settlements – areas that previously lacked detailed, up-to-date geospatial information. When communities are represented on the map, their needs and challenges become more visible, allowing more resource planning and inclusive decision-making.
Additionally, the project empowered local youths by equipping them with digital skills in mapping and data analysis through direct involvement in data collection. This approach not only promoted sustainability but also contributed to the Bangladesh government’s vision of building a digital nation.
Critical facilities mapped in Mirpur before and after the Dhaka Thrive project's pilot data collection in 2024 | Map visualization: Honey Fombuena / Open Mapping Hub - Asia-Pacific
Data Uses for Youth-Led Climate Resilience
As part of the Climate Resilience Fellowship, our other project in Bangladesh, local youth fellows used the Dhaka Thrive Dashboard to guide their community-driven projects addressing a range of climate risks in Dhaka’s informal settlements. From using the dashboard to inform site selection to applying its mapping methodology and data visualization in their own initiatives, fellows were able to create meaningful, context-specific solutions based on data-driven insights.
Using insights from the Dhaka Thrive Dashboard, fellows from the Climate Resilience Fellowship designed, led, and implemented initiatives tackling diverse climate challenges such as waste, dengue, and heatwave. | Photo: OSM Academy, The Resilient Trashformers, D-PACT
This shows why having a centralized platform that is truly open is crucial: any stakeholder, including community members, can access and use the data to guide their work. In addition, they can integrate new data into the dashboard, ensuring it remains up-to-date and reliable.
Discover how youths used the Dhaka Thrive Dashboard for climate resilience in our case story article.
Key Takeaways and Path Forward
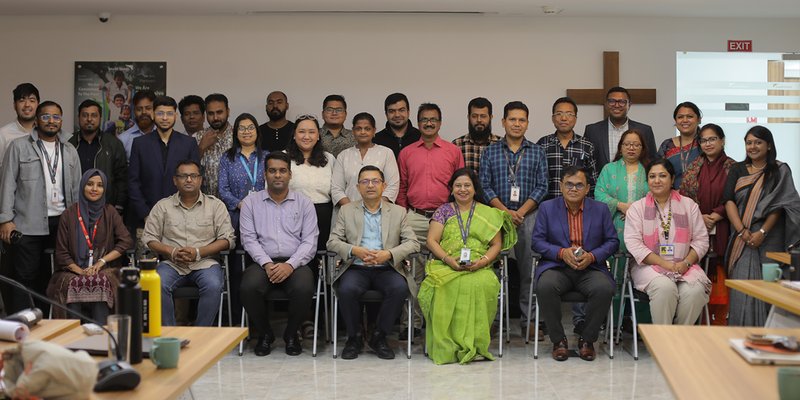
Dissemination workshop in Dhaka, Bangladesh to share output and findings from the project (November 2024). The workshop was attended by local stakeholders from government agencies, NGOs, and university representatives. | Photo: Arman Nahian
The Dhaka Thrive project demonstrated the power of open geospatial data to address climate change and urban challenges. By combining community-driven open data with data-driven insights, it laid the groundwork for climate-resilient cities.
With the city’s continuous growth and shifting population dynamics, smart and inclusive urban planning will become even more critical. Strong data, community participation, and collaboration across all stakeholders are key to a lasting framework for urban resilience.
Building on the success of Dhaka Thrive, a new initiative will be launched with a focus on documenting dengue risks. Using community-led mapping, open data, and local stakeholder engagement, the project aims to improve monitoring, prevention, and response to dengue in Dhaka’s informal settlements. Follow our next work here.
More from Dhaka Thrive: Videos and Resources
1) Video: Data Collection and Community Story in Mirpur & Stakeholder Dissemination Workshop
2) Read our feature article in the Global Climate Watch.
3) Read and download our project report.
4) Explore photos from the project here.
Join Us in Strengthening Dhaka’s Urban Resilience
1) Explore - Dive into the Dhaka Thrive Dashboard to gain valuable insights and discover its potential to support or inspire your work.
2) Expand - If you live in or around Dhaka, contribute to our participatory mapping through this form.
3) Share - Help spread the word by sharing the project, data, and dashboard with potential users, partners, and communities who can benefit from them.
Interested to learn more, or thinking about creating a similar dashboard for your project? Reach out to us at openmappinghub.ap@hotosm.org.
Cover photo credit: Honey Fombuena / Open Mapping Hub - Asia-Pacific