Collaborative Approaches to Mapping Damage in Lebanon
Lebanon is facing a recovery from crisis, and the Humanitarian OpenStreetMap Team (HOT), with support from the H2H Network and in partnership with OSM Lebanon, is leading a global and local effort to turn incomplete maps into reliable data for a stronger response. Using open mapping tools and a growing OpenStreetMap (OSM) community in Lebanon, we are building accurate infrastructure and land use datasets to help humanitarian organizations deliver aid where it is most needed and better understand the evolving humanitarian landscape in the country. This work is part of a larger initiative to raise awareness and mobilize support for displacement and safe migration as part of our program on Conflict and Displacement.
Table of Contents
Background
The humanitarian crisis in Lebanon reached a critical point, with up to 25% of buildings along the southern Lebanese border damaged or destroyed as of October 2024. The conflict, which escalated in October 2024, led to displacement, limited resources, and a need for accurate data to plan and implement humanitarian interventions. Understanding the extent of damage to infrastructure was essential for advocacy, resource allocation, and operational planning.
In such a complex environment, reliable geospatial data was not just useful—it was essential for humanitarian aid programming. To address critical information gaps, HOT, supported by the H2H Network, initiated a project to enhance Lebanon’s mapped infrastructure, focusing on pre-conflict building footprints. This initiative aimed to provide humanitarian organizations with the resources needed to understand damage assessment methodologies, plan aid delivery, and assess the impact of the conflict on affected populations.
Understanding the Geospatial Gaps in Lebanon
Lebanon’s diverse geography, combined with the ongoing conflict, created significant challenges in acquiring accurate and actionable data.
-
Incomplete Building Footprints: Existing datasets, such as Microsoft Machine Learning (ML) buildings, lacked the precision needed for reliable damage assessments. For example, Microsoft ML buildings often missed structures or grouped multiple buildings together, leading to inaccurate damage estimates.
-
Chart and maps from ML, Google and Overture
-
Data Gaps in Rural Areas: Rural regions faced a near-complete absence of reliable geospatial data, making it difficult to detect damage remotely or plan logistics for aid delivery.
-
Map on rural areas
-
Multiple Damage Methodologies: There were various approaches to damage analysis, each with different inputs, outputs, and levels of transparency. This diversity complicated the data landscape for humanitarian decision-makers.
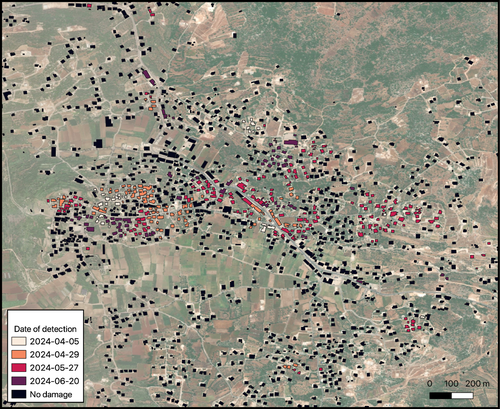
Source: Damage analysis of Copernicus Sentinel-1 satellite data by Corey Scher of CUNY Graduate Center and Jamon Van Den Hoek of Oregon State University. Microsoft building footprints.
The Role of Open Mapping, AI and Data Accuracy in Lebanon
HOT’s project leveraged the power of open mapping and community-driven data collection to fill critical data gaps and improve the accuracy of damage assessments.
- Crowdsourced Mapping: Using HOT’s Tasking Manager, global volunteers and the OSM Lebanon community digitized pre-conflict building footprints across the most affected areas, including southern Lebanon. This effort was supported by MapSwipe, a tool that allowed volunteers to quickly review aerial imagery for the presence of buildings, particularly in rural areas.
- Data Quality and Validation: HOT conducted rigorous quality checks to ensure the accuracy of the building footprint dataset. This included validating data through partnerships with local organizations like the Lebanese Red Cross and global stakeholders such as UNOSAT and Oregon State University.
- Assessing AI Methodologies: HOT did not use AI to fill data gaps but instead evaluated the accuracy of AI-generated datasets and compared their methodologies. This included piloting a comparison between crowdsourced damage detection and automated methods to identify strengths, limitations, and gaps in AI-based approaches. By doing so, HOT aimed to provide humanitarian actors with a clearer understanding of how different methodologies could be used effectively and responsibly in damage analysis.
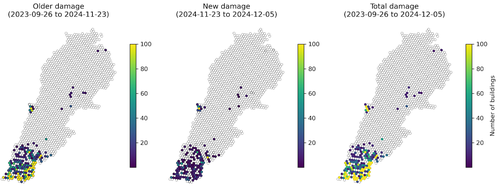
Source: Damage analysis of Copernicus Sentinel-1 satellite data by Corey Scher of CUNY Graduate Center and Jamon Van Den Hoek of Oregon State University. Microsoft building footprints.
Building a Community of Practice for Damage Analysis
To address these gaps, HOT worked with the OSM community in Lebanon and global volunteers to create a complete and highly precise dataset of pre-conflict building footprints. This dataset served as a baseline for damage detection, enabling more accurate and timely assessments as the crisis unfolded. In addition, HOT created a comprehensive review of available damage analysis methods, summarizing their strengths, limitations, and use cases.
One of the key challenges in Lebanon’s crisis was the diversity of damage analysis methodologies. To address this, HOT created a landscape assessment of available damage methodologies, summarizing their strengths, limitations, and use cases. This resource served as a guide for humanitarian actors, helping them navigate the complexities of damage data and make informed decisions.
HOT also fostered a community of practice among damage analysis stakeholders. This collaborative approach aimed to create a shared understanding of how different methodologies could complement each other, ensuring that data was used responsibly and effectively.
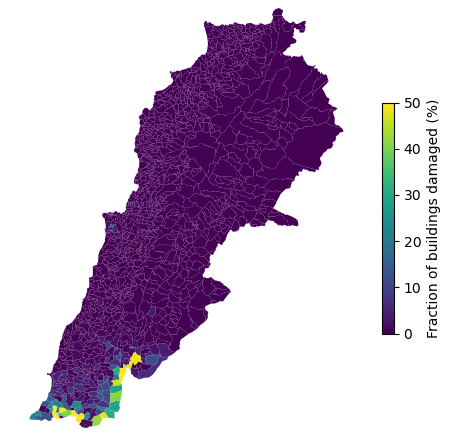
*Source: Damage analysis of Copernicus Sentinel-1 satellite data by* Corey Scher *of CUNY Graduate Center and* Jamon Van Den Hoek *of Oregon State University. Microsoft building footprints.*
Data Access and Use
Country-Level Data
All map edits were made live in OSM and could be accessed through HOT’s Export Tool or the Humanitarian Data Exchange (HDX). Below were key datasets available for Lebanon:
- Buildings: Pre-conflict building footprints for damage analysis.
- Roads: Road networks for logistics planning.
- Health Facilities: Locations of hospitals and clinics.
- Education Facilities: Schools and universities.
- Points of Interest: Key landmarks and infrastructure.
Download Based on Areas of Interest
You could also create your own export using the HOT Export Tool, an open service that created customized extracts of up-to-date OSM data in various file formats.
Get Involved
This project required sustained commitment from volunteers, partners, and the global community. Together, contributors helped ensure that Lebanon’s maps became more suitable for recovery, relief, and planning.
If you wanted to contribute, you could refer to the wiki, where different projects, initiatives, and activities were listed.
Organizations working in Lebanon or other conflict-affected areas, or those interested in supporting in other ways, were encouraged to contact info@hotosm.org to partner, volunteer, or donate to ongoing efforts in conflict-affected areas worldwide.
Cover photo: Wikipedia - NASA, Satellite picture of Lebanon - Licensed under CC BY-SA 4.0
