


Rebuilding Porto Alegre in Brazil: How Open Mapping Unlocked a US$161 Million Loan for Social Infrastructure After the 2024 Floods
Posted by Mar Marín Villagrana, Karla Picado, Céline Jacquin • Sept. 22, 2026
After the 2024 floods in Porto Alegre city (Rio Grande do Sul, Brazil), teams from the Inter-American Development Bank (IDB) and Humanitarian OpenStreetMap Team (HOT) assessed damage across the flood-affected areas of the city. They ranked areas by flood risk, from the hardest-hit to those least likely to flood again, and treated the low-lying islands region as the top priority, given the river's recurring rise and fall. They went into health units, schools, and social assistance facilities, and built an online form through an open technology, KoBoToolbox, for local officials to report on damage levels. Building by building, the team then managed and organized that data into the baseline dataset used to estimate the investment needed for planning.
Months later, this data became the key indicators and budget elements that defined the real cost of the US$161 million investment Porto Alegre needed to rebuild its social infrastructure. Its direct impact is concrete: 36 health facilities rehabilitated or built, 18 schools rehabilitated, 23 social protection centers rehabilitated or built, and new community spaces and housing for older adults, alongside programs reaching 9,600 students, 6,000 preschool children, 6,000 people living in extreme poverty, and 6,500 young people and adults. The contract between the IDB and the Municipality of Porto Alegre was signed with just eleven days to spare before the administrative window closed.
Porto Alegre Floods
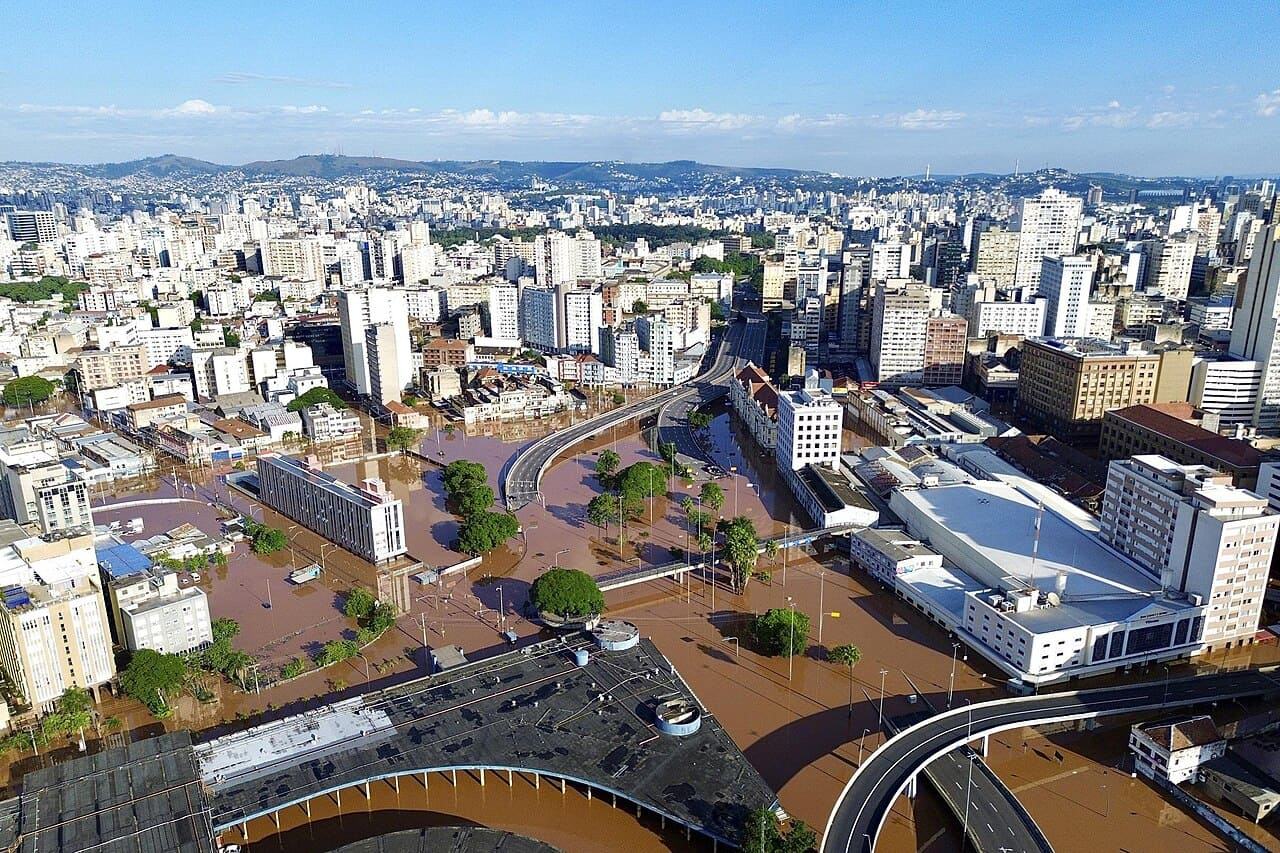
On April 27, 2024, after two weeks of intense rain in Rio Grande do Sul state, the collapse of the 14 de Julho hydroelectric dam worsened an already critical situation. More than 160,000 people were affected, nearly 94,000 homes were damaged, around 420 public facilities were partially or fully destroyed, and more than 1,000 kilometers of public roads were knocked out of service. The Guaíba River reached record levels and flooded the Porto Alegre city's historic center for more than a month.
The IDB and the Municipality of Porto Alegre had already been working together before the disaster, improving schools, health centers, and social service facilities, establishing the relationship needed to be able to react. That previously approved loan became the foundation to rebuild on, but its original scope no longer matched what the floods had destroyed, so it had to be reformulated to redirect it toward recovery, something the bank, in its entire history, had only done once before.


These images show the scale of the 2024 floods in Porto Alegre, when the Guaíba River reached record levels and kept the city's historic center underwater for more than a month.
Photos: Gustavo Garbino and Giulian Serafim / PMPA via Wikimedia Commons.
Ground Data for a Decision Against the Clock
"We had to have a lot of information for that to be approved by a board that had already approved an operation format, and even more so, for it to also be approved by the Federal Government," explains Gabriela Couto, an engineer and operations analyst in the IDB’s Education Division. In Brazil, any international loan needs two approvals: one from the bank itself, and one from the Federal Government, a particularly delicate requirement, since Porto Alegre, at that moment, had no fiscal space to take on international loans.
What made that double approval possible was precisely a damage assessment survey the team carried out in the field. It was a large exercise that would normally take months to scope, develop, and execute, but the independence and speed of open-source tools made it possible to do during a single intensive mission, through rapid construction of the instrument, agile data collection, and distributed reporting with local officials. That speed mattered because it broke a too-common administrative trap: a government drowning in crisis, with no capacity to spare, still has to produce the strong field-based documentation that costs large amounts of budget and staff time, just to request the funds that would let it act in the first place.
The main annex they used to justify the operation before the bank's board and the Federal Government was a map: the spatial distribution of existing social facilities, the ones the operation already covered, and the ones that could be added. "We built a map that told us what we were going to build, what we were going to recover, and what there was no way to recover," Gabriela says. "All of that was georeferenced, and we used it as our technical infrastructure annex."
Explore more than 12,000 street-level images captured in the field by the HOT team. Navigate through them in the viewer below, or open the full collection in Mapillary to see where each image was taken on the map.
A Clear Map of What Needed Rebuilding, and Where
The financing had a hard deadline: December 31, 2024, the close of the fiscal year and of the Brazil legislative period within which the national government could authorize the operation. If the contract wasn't signed before that date, there would be no second chance that year; the process would fall outside the deadline and have to restart from scratch in the next cycle, with no guarantee of conditions.
The team signed on December 20. The operation strengthens the assessment and recovery of four service networks that work together to serve the people most affected by the floods:
- Health: 36 rehabilitations and constructions, equipment for the facilities, and mental health programs for women affected by the floods, especially mothers and heads of household, with therapy sessions and support groups.
- Public education: 18 schools rehabilitated, tutoring for 9,600 students, including students with disabilities, and preschool access for 6,000 children.
- Social protection: 23 centers rehabilitated or built, programs for 6,000 people in extreme poverty, support for people experiencing homelessness, and a shelter for future emergencies.
- Social development: housing for older adults whose homes were most affected, 3 community and sports spaces rehabilitated, and job training for 6,500 young people and adults in high-demand sectors.
What made that speed possible wasn't just the data itself, but the method behind it: instead of routing data collection through the usual administrative channels, where, as Gabriela describes it, a request "would sit on someone's desk for weeks," field teams gathered it directly, using the open-source tool KoBoToolbox, with HOT supporting as an external partner free of administrative silos. That shift didn't require new ideas so much as new capacity: the ability to collect and organize data at a pace the deadline demanded. "We only managed to sign this contract because we did everything much faster than normal, and the technical information is what allowed us to do that," Gabriela says. A reformulation like this usually takes about a year. This one took six months.
That margin wasn't just a matter of administrative speed. It was, Gabriela says, the direct result of already having, from the start, a clear map of what needed rebuilding and where: the difference between defending a figure with a verifiable list of units, or trying to defend it with nothing concrete to show. The operation was worth US$161 million, and the Federal Government had made clear that only activities tied to Porto Alegre's recovery could stay in. Having a clear list of what would be built, renovated, or replaced made it possible to estimate costs and hold on to that amount. The map was what gave that figure something to stand on.
Having that first, detailed map is what let the team keep track of every building: knowing which ones were already covered by another funder, and which ones still needed the IDB.
The map also shaped what gets built, and where. In the island region, where the river rises and falls every year, the municipality is acquiring mobile health and social assistance units that can leave before the water arrives and return when it recedes. Climate refuge centers will be built on safer ground, after the flood showed that the city's two stadiums, its usual shelters, sat right on the river. And new facilities are being designed to withstand future floods. Data gathered with local officials, and open to all of them, is helping the city prepare for the next event, not just recover from this one.
Arriving on time with the right information gave the Porto Alegre government, from day one, a loan sized against real data on the ground, the foundation the city could begin rebuilding on and keep making decisions on long after.

Schools in Porto Alegre resumed classes on May 20, 2024, after being closed by the floods. Getting schools, health units, and social assistance centers back in operation is a key step for communities to recover.
Photo: Júlia Azevedo / SMED / PMPA. Source: Agência Porto Alegre, via Wikimedia Commons (Creative Commons Attribution).
Céline Jacquin, Senior Manager for Latin America, highlights that: "that timing was possible because of the kind of data this was: open, shareable, built to be reused rather than locked inside one institution's system or department. That's the logic an open-source ecosystem runs on, and it's what lets the information move as fast as the moment required, collected, adjusted, and acted on directly, instead of waiting on permissions or proprietary systems to catch up."
In a crisis, that speed isn't a convenience; it can be the difference between a response arriving in time or never being carried out. A crisis has more than one face. "People were still living in the mud, schools stayed closed indefinitely," says Céline Jacquin, HOT's Senior Manager for Latin America, "and at the same time, an international loan runs on exact, unmovable deadlines." Open data was what let Porto Alegre's response keep pace with both. That pace mattered because behind the deadline were more than 160,000 people affected by the floods, and a city that needed schools, health units, and social services able to withstand the next crisis. Government, development partners, and field teams could respond together because they shared the same data.
Cover image: Flooded historic center of Porto Alegre, May 5, 2024. Photo: Gustavo Garbino / PMPA, via Wikimedia Commons (Creative Commons).
Share